Circular Dichroism (CD) Spectroscopy
Circular Dichroism (CD) spectroscopy is an essential analytical technique used to analyze chirality in molecules through their optical activity.
- Introduction to Circular Dichroism Spectroscopy
- Instrumentation of Circular Dichroism Spectroscopy
- The Use of Circular Dichroism Spectroscopy to Study Protein Folding, Form, and Function
- Experimental of Circular Dichroism Spectroscopy
- Circular Dichroism Webinar
Introduction to Circular Dichroism (CD) Spectroscopy
Circular Dichroism (CD) spectroscopy is an essential analytical technique used to analyze chirality in molecules through their optical activity. CD can be applied to a wide variety of molecular structures but has found favor in the scientific community for the elucidation of macromolecular structure, especially proteins and nucleic acids.
Circular Dichroism spectroscopy exploits the fundamental property described by the ‘Cotton Effect’. See here the Wikipedia article. Circularly polarized light may be preferentially absorbed by an optically active molecule in the viscinity of a chromophore.
Circular Dichroism spectroscopy is a technique where the difference in the absorption of left and right circularly polarized light in optically active substances is measured. CD signals are observed for optically active (chiral) materials; however, chirality can also be induced via covalent bonding to a chiral chromophore or when the chromophore is placed in an asymmetric environment. CD is typically used for protein conformation, structural analysis of biomolecules, and chiral discrimination.
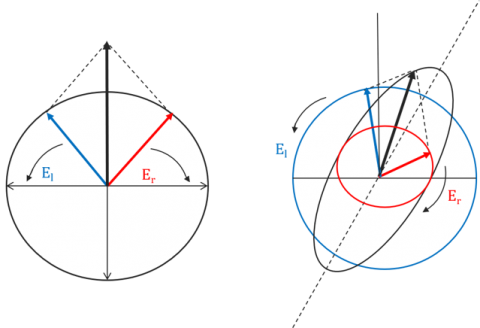
Electromagnetic waves contain electric and magnetic field components that oscillate perpendicularly in the direction of a light beam’s propagation. The directionality of these components defines the waves’ polarization. In unpolarized light or white light, the electric and magnetic fields oscillate in many different directions. In linearly polarized light, the electromagnetic wave oscillates along a single plane (Figure 1, left), while in Circularly Polarized Light (CPL) two electromagnetic wave planes are at a 90° phase difference to one another and this plane rotates as the light beam propagates (Figure 1, right).

Optically active molecules can be described by their chirality, or the asymmetry in a molecule’s structure. Chiral molecules exhibit circular birefringence or optical rotation, where the velocity of the light passing through an optically active medium will differ depending on the medium’s refractive index. Therefore, left-handed CPL will propagate through a chiral sample at a different speed than its right-handed counterpart. When a chiral molecule absorbs left- and right-handed CPL to different degrees the resulting electric field vector traces out an ellipse. Since linearly polarized light can be thought of as a superposition of equal intensities of left- (El) and right-handed (Er) circularly polarized light, as the circularly polarized light travels through the birefringent material, the phase relationship between the CPL waves changes and the linearly polarized wave is rotated and the elliptically polarized light is now tilted (Figure 2). This ellipticity (q) as a function of wavelength defines a circular dichroism spectrum.
Instrumentation of Circular Dichroism Spectroscopy
Photoelastic Modulator (PEM)
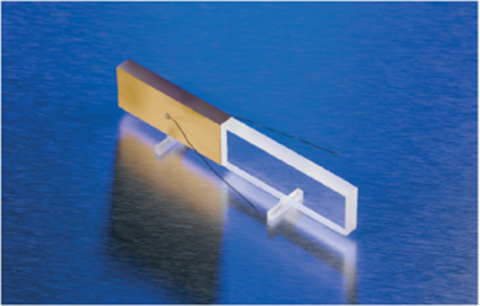
In a circular dichroism spectrophotometer, linearly polarized light is created to later produce circularly polarized light. Unpolarized light first passes through a polarizer in which the crystal axes and the orientation of the molecules are aligned. A photoelastic modulator (PEM) is then used to convert the linearly polarized light into circularly polarized light. As seen in Figure 3, the PEM is a pizoelastic element, cemented to a block of fuzed quartz. When a 50 kHz frequency is applied to the pizeoelastic element, it stresses the quartz piece, inducing birefringence and two polarization components. Circular polarization occurs when the phase of an orthogonal electric field deviates by 1/4 wavelength.
Nitrogen Purge
The xenon arc lamp creates a substantial amount of UV radiation. When this radiation interactions with oxygen molecules, it creates ozone. Ozone oxidizes the surface of the mirrors in the instrument, decreasing their reflectivity and efficiency to focus light through the monochromator, reducing the S/N. Additionally, oxygen itself is absorbed in the UV region. By purging the monochromator with nitrogen, not only do the mirrors retain their reflectivity and longevity, but the oxygen absorption is decreased, allowing sample data to be acquired further into the far-UV. Figure 4 provides nitrogen purging suggestions
CD is an ensemble technique that provides information on the molecular and electronic structure of chiral chromophores, both quantitatively or empirically. Chromophores that are not intrinsically chiral can be placed in an asymmetric environment or coupled to chiral chromophores, where CD can be induced into these achiral electronic transitions. Most CD experiments require little sample preparation, are easy to perform, and are non-destructive so sample can be recovered. Sample measurements can be acquired in in liquid phase or as solid, films, or gels, at low concentrations compared to other molecule structure techniques.
The Use of CD Spectroscopy to Study Protein Folding, Form, and Function
Secondary Structure of Proteins through Circular Dichroism
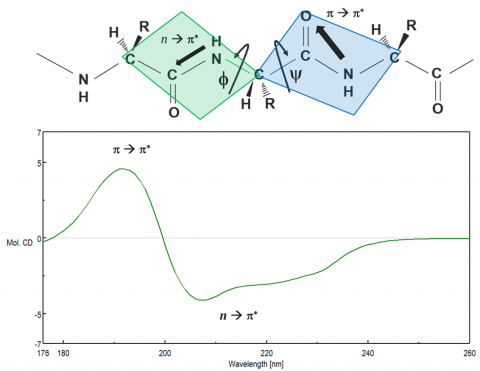
Proteins adopt unique conformations, optimized to perform specific structural, regulatory, or enzymatic functions. Therefore, the information on the protein structure is paramount to elucidating how proteins function. The far-UV (180-250 nm) region probes the peptide backbone chain, whose phi and psi angles rotate depending on the protein conformation. There are two absorption bands that make up the far-UV CD spectrum: a strong p à p* around 190 nm and a weaker but broader n à p* transition between 210-220 nm, seen in Figure 6.
These two absorption bands give rise to different characteristic bands (Figure 7) that can be deconvoluted to estimate the secondary structure components of the protein under different solution and environmental conditions. While each of the four secondary structure components (a-helical, b-sheet, turn, and unordered) have distinguishing CD spectra, deconvolution is more complex than assigning a band to each component. Secondary structure analyses require curve fitting procedures based on a set of reference spectra with known secondary structure components that is used to estimate the components in the unknown (or sample) spectrum through regression analysis. The aromatic side chain residues and disulfide bonds are also known to contribute to the far-UV spectrum, further complicating estimations. Secondary structure analysis is best used to clarify shifts in CD data. More similar secondary structures, such as b-sheet and turn, can be teased out and structural changes from a majority of sheet to a majority of turn can be confidently confirmed.

Tertiary structure
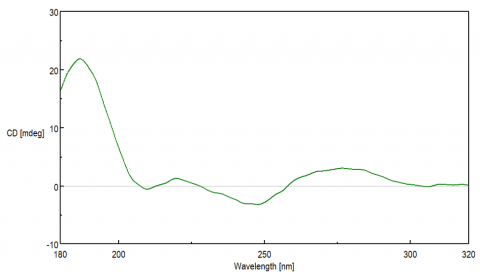
The near-UV CD spectrum (250-320 nm) reflects the protein tertiary structure, made up of the aromatic amino acid side chains. The three residues, phenylalanine, tyrosine and tryptophan, exhibit fine structure peaks between 255-270 nm, 275-285 nm, and 290-305 nm, respectively. The number and proximity of the aromatic residues will affect the strength of the CD signal, as well as the disulfide bonds, degree of hydrogen bonding, and rigidity of the chromophores in folded conformations.
DNA Structure
The CD spectra of DNA provides information on the molecule’s secondary structure that is dependent on the stacking orientation of the base pairs. While the base pairs themselves are not intrinsically chiral and alone would not exhibit a CD signal, they are covalently bound to the DNA backbone chain composed of sugar moieties. The chirality of the sugar groups induces a CD signal in the base pair’s p à p * transition, observed from 200-300 nm.
Each DNA conformation displays a distinct CD spectrum. The most well known B-form, discovered by Watson and Crick, is a right-handed double helix whose base pairs are perpendicular to the helix. A positive maximum at 290 nm, negative maximum around 245 nm, and a broad positive peak between 260-280 nm are typically seen for B-form structures. The A-form is more compact, right-handed double helix structure that is typically observed for RNA and exhibits a positive peak at 260 nm and a negative peak at 210 nm. The Z-form structure is a left-handed double helix that displays a negative band at 290 nm, a positive peak at 260 nm, and negative maximum ~200 nm. G-quadruplex (G4) secondary structures are unique in that they fold into four-strands that are rich in guanine. These quadruplexes can form either parallel or anti-parallel structures depending on the stacking interactions of the guanosine residues. Parallel G4 structures have a positive band at 260 nm while the anti-parallel structures exhibit a negative band at 260 nm and a positive peak at 290 nm.
Thermal Stability
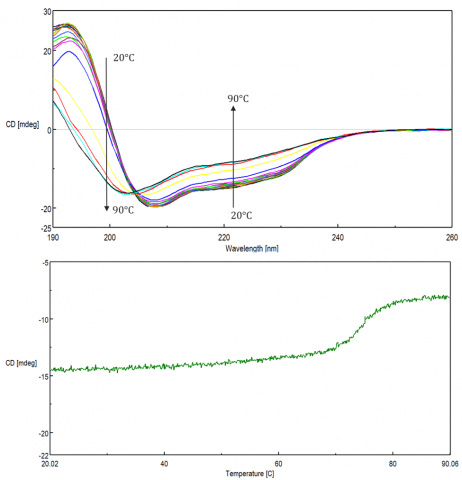
Changes in temperature can affect biomolecular structure and induce aggregation, leading to various disease-related conformations, as well as influence the stability during storage and efficacy of biopharmaceuticals. These studies are used to monitor protein folding/unfolding, as well as the effect of solvents, pH, and ligands on the thermal stability of biomolecules. Thermal stability is assessed either by monitoring single wavelengths at the peak of interest as a function of temperature (Figure 9, top) or by acquiring spectral scans at increasing temperatures (Figure 9, bottom).
Protein folding reversibility is commonly investigated to verify whether a protein can undergo structural changes when heated and revert back to its native form when cooled back down to the initial temperature. If the protein folding is reversible during temperature measurements, then thermodynamic parameters such as the Gibb’s free energy, (DG) enthalpy (DH) and entropy (DS) changes, and melting temperature (Tm) can be acquired by fitting the thermal melting curve.
Experimental of Circular Dichroism Spectroscopy
Beer’s Law: Sample Concentration and Cell Pathlength
CD is an absorption technique based on Beer’s Law
A=εlc
where A is the absorbance, e is the molar absorptivity constant, l is the cell pathlength, and c is the chromophore concentration. Therefore, the amount of light absorbed by the sample is dependent on concentration and pathlength and critical to obtaining accurate CD data. Usually, the optimal S/N is obtained when the optical density of the absorption maximum wavelength is ~1. Figure 10 additional concentration and cell pathlength guidelines for a variety of chromophores.
Conveniently, the sample concentration and cell pathlength can be adjusted to account for absorbance limitations. For example, if the sample absorbance is too large but the concentration cannot be reduced for experimental purposes, the cell pathlength can be shortened to acquire the necessary measurements. Likewise, if only one cell pathlength is available, the sample concentration can be increased to obtain data with a sufficient S/N.
Aside from the pathlength selection, the cuvette or cell material and volume are also important parameters to consider when performing circular dichroism experiments. For measurements below 200 nm, quartz cuvettes are necessary due to their transparency in the far-UV. While most quartz rectangular cuvettes have little to no birefrigence and flat baselines, baseline measurements should be performed to ensure no optical artifacts are observed due to the strain on the cuvettes. Additionally, these cell baseline measurements can elucidate the cleanliness of the cell. While demountable cells hold much smaller volumes than the tradition 1 and 10 mm pathlength cuvettes, these cells cannot be used for temperature dependent measurements since they are not completely sealed, resulting in heat lose. It is also important to verify the pathlength of demountable cells after sample as been loaded to ensure the correct pathlength, especially is the molar ellipticity or mean residue molar ellipticity is later calculated. Rectangular microcells are available for small volume measurements and come in a variety of volumes and pathlengths. JASCO also offers two microsampling accessories; a disc for spectral scans using only 2 or 10 mL and a capillary cell for thermal stability studies.
Solvent Effects
The buffer or solvent the sample is in will also affect the CD spectrum. Solvents used for absorption measurements will typically suffice; however, the following conditions should be taken in consideration when choosing a solvent for CD measurements: (1) solubility, (2) transparency in the wavelength range being probed, (3) optically inactive, and (4) sample stability. Condition 2 is especially important for secondary structures studies in the far-UV, since many solvents absorb strongly below 200 nm, as well as denaturing agents such as guanidinium chloride and urea. The addition of salts to buffers will may also increase absorbance and potentially induce scattering, reducing the S/N. Sugar-based formulation buffers not only absorb highly in the far-UV but also have a CD signal and should be avoided for CD measurements
Digital Integration Time and Scanning Speed
The digital integration time or D.I.T. is the amount of time that the data is integrated over or the length of time the detector collects photons before transferring the signal to the A/D converter for processing. The square root of the D.I.T. is proportional to the signal to noise, so the longer the D.I.T. the better the S/N. Increasing the D.I.T. will have a more substantial effect when a sample’s CD signal is small since there is less signal.
The scanning speed determines how quickly the monochromator scans through the specified wavelength range to acquire data points at the specified data pitch. When used in continuous scan mode, the scanning speed must be selected with an appropriate D.I.T. to prevent distortion in the measured spectrum. The following guideline can be used when selecting the D.I.T. and scanning speed
D.I.T. × Scanning speed< FWHM⁄3
where FHWM is the full width at half the peak height of the target peak. Figure 12 illustrates the effects of the scanning speed and digital integration time on the far-UV CD spectra.
Accumulations
The number of spectral scans that are automatically obtained and averaged together are specified by the accumulations. The spectrum S/N is proportional to the square root of the product of the D.I.T. and number of accumulations. While increasing the number of accumulations will increase the S/N, it will also increase the measurement acquisition time. When selecting the number of accumulations and D.I.T., baseline drift and peak widths should be taken into account.
CD Units
CD spectra are reported as ellipticity, θ and measured in units of mdeg but can easily be converted based on the user’s application. Molar absorptivity (∆ε) normalizes the circular dichroism spectra based on concentration and pathlength,
∆ε=εl-εr=∆A/(c∙l)=θ/(c∙l∙3298)
where ε_l-ε_r is the difference in the extent the left-(l) and right-(r) circularly polarized light components are absorbed at a given wavelength,∆A is the difference in absorbance, c is the concentration (mol/L), and l is the pathlength(cm).
When analyzing the secondary structure components, the number of amino acid residues in the protein must be accounted for and ellipticity is converted to mean residue molar ellipticity (MRME)
〖[θ]〗_MR=(θ∙c∙l)⁄R
where θ is the ellipticity (mdeg), c is the protein concentration in mol/L, l is the cell path length (cm), and R is the number of amino acid residues in the protein.
CD Webinar
This introductory webinar provides a review of circular dichroism theory and instrumentation basics, as well as common biological applications including:
- Structural characterization of proteins
- VHH Antibody stability evaluation
- Thermal stability studies
- Structural characterization of nucleic acids
- Microassay methods
Powerpoint slides can be downloaded here.