Monitoring Microbial Fermentation Using Raman Spectroscopy
June 18, 2026 Download This Application
Introduction
Fermentation is a form of enzymatic decomposition carried out by microorganisms such as bacteria, mold, and yeast. Alcoholic fermentation occurs through the action of yeast, and is a biological process in which sugars such as glucose and sucrose are converted into ethanol and carbon dioxide. Yeast is also used in the production of bread and alcoholic beverages.
Alcoholic fermentation of glucose: C6H12O6 → 2C2H5OH + 2CO2
In fermentation, it is important to optimize the fermentation temperature and time according to the microorganisms used. In this experiment, Raman spectroscopy was used to analyze the alcoholic fermentation process. Raman spectroscopy is a convenient technique for analyzing liquid samples in containers because spectra can be obtained directly from the laser-focused position with minimal sample preparation. In addition, Raman spectroscopy is less affected by water than infrared spectroscopy, making it suitable for aqueous fermentation samples. This report describes the use of a PR-1w Palmtop Raman Spectrometer to monitor the progress of alcoholic fermentation using two types of yeast. This method is suitable for real-time reaction monitoring and the time-dependent data can be analyzed using two-dimensional correlation spectroscopy.
Experimental
Samples
Sugar, 20 w/v% sucrose solution: 2 mL
Yeast, dry yeast: 5 mg (2 types [Yeast A and B])
Measurement Protocol
- Prepare a sucrose solution
- Place the solution in a rectangular quartz cuvette and maintain it at 35ºC using a hot plate magnetic stirrer
- Add dry yeast powder and mix for approximately 2 min
- Cover the cuvette lightly with aluminum foil and leave it on the hot plate at 35ºC
- Measure time interval scan data using a Palmtop Raman Spectrometer
System
To allow monitoring of alcoholic fermentation at constant temperature, a system (Figure 1) consisting of a Palmtop Raman Spectrometer held horizontally and a hot plate magnetic stirrer is used.
Instrument: PR-1w Palmtop Raman Spectrometer
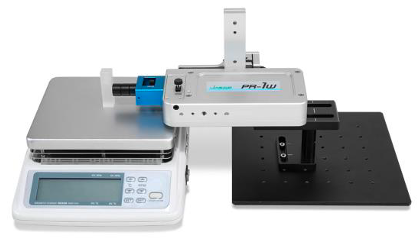
Accessory: PR-1-Z Z stage unit
PR-1-Z-EX Option kit for PR-1-Z
Software: PR-ITS-1W Interval measurement analysis program for PR-1w
Parameters
Laser wavelength: 785 nm
Laser power: 50 mW
Exposure time: 3 sec
Accumulation: 32
Time interval: 5 min
Data points: 145 points (12 hours)
Hot stirrer temperature: 35ºC
Keywords
Bacteria, Yeast, Alcoholic fermentation, Bioreactor, Liquid culture, Reaction, Time interval scan measurement, Raman spectroscopy, Two-dimensional correlation spectroscopy, Palmtop Raman Spectrometer
Results
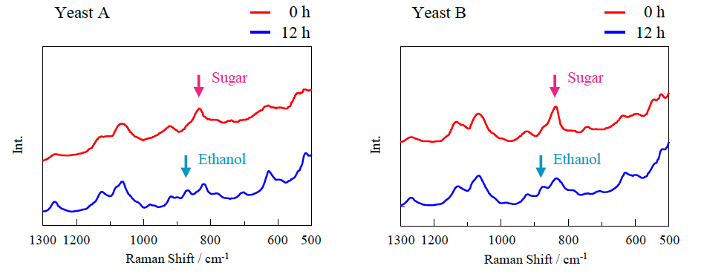
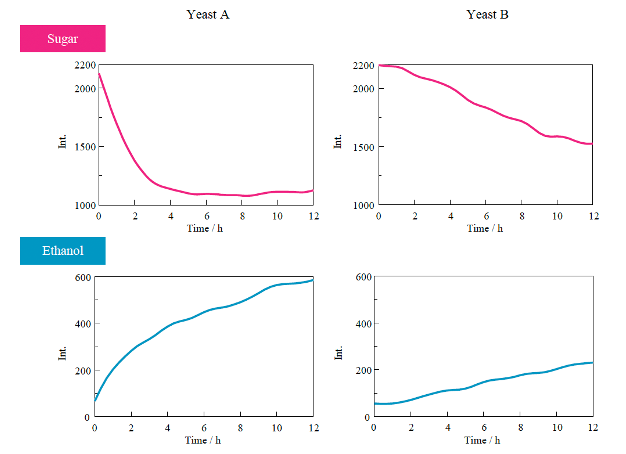
In the spectra shown in Figure 2, a sucrose peak, hereafter referred to as the sugar peak, was observed at the start of the measurement for both yeast type, after 12 hours of measurement, an additional peak attributed to ethanol was observed. Figure 3 shows the time-dependent changes in the sugar and ethanol peak heights, which reflect changes in the relative concentrations of these components. For yeast A, the sugar concentration reached a steady state after approximately 5 hours, whereas for yeast B, the sugar concentration continued to decrease even after 12 hours. These results indicate that the sugar degradation rate depends on the yeast type. For both yeast types, the ethanol peak height increased as the sugar peak height decreased.
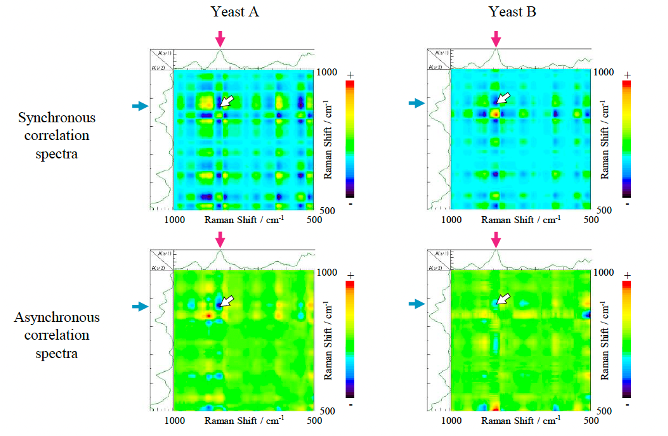
Then, the time-dependent spectra obtained for yeasts A and B were analyzed using two-dimensional correlation spectroscopy, which evaluates changes in spectral peaks with time.
As shown in the synchronous correlation spectra in Figure 4, a negative cross-peak is observed at 835 cm-1 (corresponding to sugar) and at 873 cm-1 (corresponding to ethanol). This result Indicates that the intensity of these two peaks changed in opposite directions. The same trend Is evident in figure 3, where the ethanol peak height increases as that for sugar peak height decreased. In the asynchronous correlation spectra shown in figure 4, a negative cross-peak is also observed between the sugar and ethanol peaks. The combined synchronous and asynchronous results indicate that the change in the sugar peak occurred before the change in the ethanol peak. These results suggest that ethanol was produced following sugar degradation. Therefore, two-dimensional correlation analysis was effective for monitoring the progress of yeast fermentation.
Conclusion
The progress of alcoholic fermentation was successfully monitored using a Palmtop Raman Spectrometer with time interval scan measurements. This approach is useful for evaluating the effects of sugar – yeast combinations, temperature, and other fermentation conditions on yeast performance and fermentation characteristics. In addition, the method can be applied to various microbial culture systems and biochemical reaction systems.
References
- I. Noda: J. Am. Chem. Soc., 111, 8116(1989). DOI: 10.1021/ja00203a008
*This experiment was carried out at JASCO Incorporated in Maryland, USA.
JASCO Incorporated Carlos Morillo, Applicative Solution Lab Division E. Taira