
Analysis of Anionic Surfactants Using Carbon-Chain Branch-sensitive Column
September 25, 2026 Download This Application
Introduction
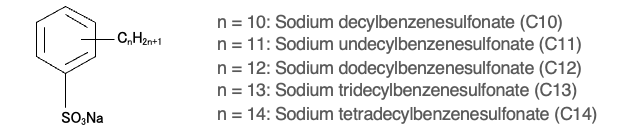
Anionic surfactants are widely used as active ingredients in synthetic detergents and serve as indicators of water contamination from industrial effluents and domestic wastewater. In Japan, these compounds are included among the water-quality parameters regulated under the Water Supply Act. The specified analytical method uses high-performance liquid chromatography (HPLC) with fluorescence detection (Notification No. 261 of the Ministry of Health, Labour and Welfare, 2003, Appendix 24) to determine sodium alkylbenzenesulfonates (ABS) with alkyl chain lengths ranging from C10 to C14. The water-quality standard for the combined concentration of these five components is 0.2 mg/L. Testing requires quantification at one-tenth of this value (0.02 mg/L), with a relative standard deviation of less than 20%.
The separation of ABS is influenced by both alkyl chain length and molecular structure. Conventional C18 columns, which contain octadecyl-bonded stationary phases, separate compounds primarily according to differences in hydrophobicity. These columns can also resolve differences in chain branching, producing multiple peaks for compounds with the same carbon number. The Unifinepak C18 column exhibits sensitivity to carbon-chain branching, enabling the separation of isomers with the same carbon number. This selectivity allows structurally distinct ABS components to be resolved within each alkyl chain-length group. This application note describes the analysis of anionic surfactants using the branching-sensitive selectivity of a Unifinepak C18 column combined with highly sensitive fluorescence detection. Recovery results obtained using solid-phase extraction are also presented to assess the method’s suitability for water-quality testing under Japan’s Water Supply Act.
Experimental
Instruments
Pump: PU-4180*
Autosampler: AS-4050
Column Oven: CO-4060
Detector: FP-4025
*With option units
LC Conditions
Column: Unifinepak C18 (4.6 mm I.D. x 250 mm L, 5 µm)
Eluent: 0.1 mM sodium perchlorate in acetonitrile/ultrapure water (65/35)
Flow rate: 1.0 mL/min
Column temperature: 40ºC
Injection volume: 10 µL
Excitation wavelength: 221 nm, Gain x10
Emission wavelength: 284 nm, Gain x10
Standard samples
Mixed standard solutions of anionic surfactants in methanol (1, 2, 5, 10, 25 mg/mL each)
Keywords
Anionic surfactant, Sodium alkylbenzenesulfonate, Water quality standards, Unifinepak C18, Solid-phase extraction, SPE, Fluorescence detector
Results
Water samples used for testing are concentrated 250-fold by solid-phase extraction (SPE) before analysis; therefore, the calibration range was selected to reflect the concentrations expected after extraction. Table 1 lists the concentrations of each component corresponding to the water-quality standard and their equivalents after 250-fold concentration. Five-point calibration curves spanning 1 to 25 mg/L per component were prepared using triplicate measurements at each concentration. All components exhibited excellent linearity, with correlation coefficients (r) of ≥ 0.9997.
Table 1. Concentration range for calibration curve calculated from standard values for five anionic surfactant components
| Concentration at sampling [mg/L] | Concentration after 250 times condensation [mg/L] | ||
|---|---|---|---|
| Standard value | Sum of 5 components | 0.2 | 50 |
| Standard value | 1 component | 0.04 | 10 |
| One-tenth of standard value | Sum of 5 components | 0.02 | 5.0 |
| One-tenth of standard value | 1 component | 0.004 | 1.0 |
| Calibration range | Sum of 5 components | 0.02 - 0.5 | 5.0 - 125 |
| Calibration range | 1 component | 0.004 - 0.1 | 1.0 - 25 |
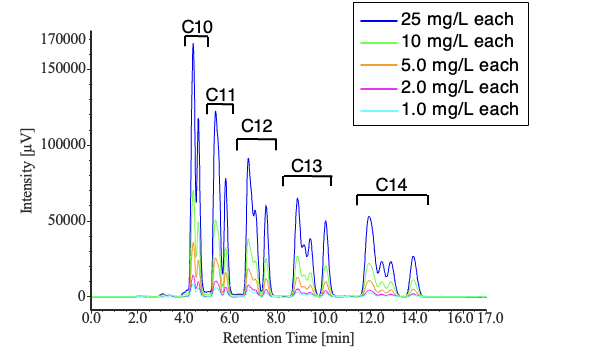
Figure 2 shows chromatograms from the third injection of the anionic surfactant standard mixture at each calibration level.
Carryover was evaluated by analyzing methanol blanks immediately after the highest-concentration standard (1.0 mg/L each). The blank chromatograms shown in Figure 3 indicate no carryover at or above the lowest calibration level.
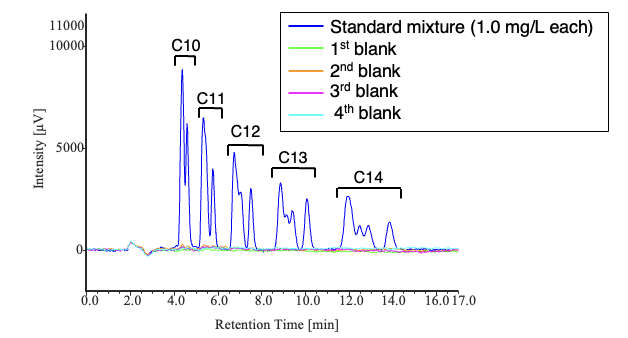
(chromatogram for standard mixture with 1.0 mg/L each is overlaid)
Table 2 summarizes the measured concentrations of the calibration standards and their accuracy, expressed as a percentage of the nominal concentration. Accuracy ranged from 93% to 107% across all components and concentration levels, meeting the specified acceptance range of 80% to 120%.
Table 2. Accuracy of measured concentrations relative to theoretical values for anionic surfactant calibration standards
| Theoretical Concentration [mg/L] | Accuracy [%]* | Accuracy [%]* | Accuracy [%]* | Accuracy [%]* | Accuracy [%]* |
|---|---|---|---|---|---|
| C10 | C11 | C12 | C13 | C14 | |
| 1.0 | 97 | 106 | 107 | 105 | 107 |
| 2.0 | 93 | 95 | 96 | 95 | 94 |
| 5.0 | 100 | 100 | 100 | 99 | 100 |
| 10 | 102 | 100 | 100 | 101 | 101 |
| 25 | 100 | 100 | 100 | 100 | 100 |
*The average of the quantitative values obtained by repeat measurements (n = 3) is used for the calculation.
Figure 4 shows chromatograms from five replicate injections of a standard representing one-tenth of the water-quality standard after 250-fold concentration.
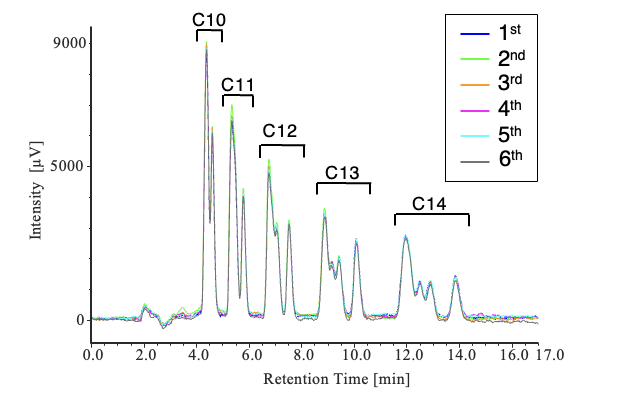
(1.0 mg/L per component, n = 6)
Table 3 summarizes the peak area repeatability for each component. Relative standard deviations (RSDs) were below 2.5% for all components, demonstrating good injection repeatability.
Table 3. Peak area repeatability for the anionic surfactant standard mixture (1.0 mg/L each, n = 6)
| Injection Number | Peak Area [µV・sec] | Peak Area [µV・sec] | Peak Area [µV・sec] | Peak Area [µV・sec] | Peak Area [µV・sec] |
|---|---|---|---|---|---|
| C10 | C11 | C12 | C13 | C14 | |
| 1 | 151,658 | 150,705 | 147,763 | 142,778 | 139,890 |
| 2 | 154,083 | 157,963 | 152,240 | 146,322 | 136,257 |
| 3 | 153,244 | 152,385 | 150,013 | 143,154 | 137,680 |
| 4 | 150,115 | 147,668 | 146,679 | 140,704 | 135,557 |
| 5 | 147,292 | 150,438 | 147,776 | 141,121 | 135,788 |
| 6 | 150,906 | 148,284 | 150,030 | 146,757 | 136,681 |
| Average | 151,216 | 151,241 | 149,084 | 143,473 | 136,976 |
| SD | 2,418 | 3,713 | 2,047 | 2,557 | 1,613 |
| RSD [%] | 1.60 | 2.46 | 1.37 | 1.78 | 1.18 |
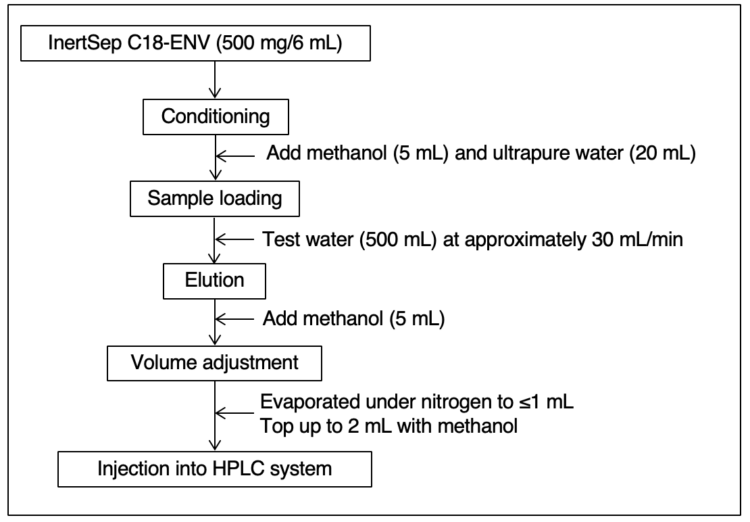
Figure 5 outlines the SPE procedure used to concentrate the water samples 250-fold. The specified extraction medium in the Water Supply Act is an octadecyl-bonded silica gel or a material with equivalent or superior performance. An InertSep* C18-ENV SPE column was used in this application note.
*InertSep is a trademark or registered mark of GL Sciences Inc.
Tap water was spiked with the five anionic surfactants at 0.004 mg/L per component and processed according to the procedure shown in Figure 5. Figure 6 presents the resulting chromatograms.
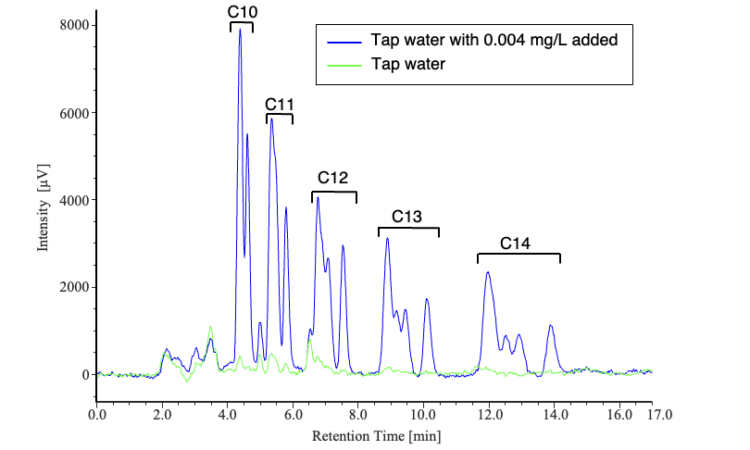
Table 4 summarizes the recovery results of Figure 6. Recoveries exceeded 76% for all components and were within the specified acceptance range of 70% to 130%, demonstrating satisfactory recovery required by the Water Supply Act from the tap-water matrix.
Table 4. Results of five anionic surfactants from spiked tap water following SPE
| Sample | Recovery Rate [%] | Recovery Rate [%] | Recovery Rate [%] | Recovery Rate [%] | Recovery Rate [%] |
|---|---|---|---|---|---|
| C10 | C11 | C12 | C13 | C14 | |
| Tap water | - | - | - | - | - |
| Tap water with 0.004 mg/L added | 76 | 92 | 94 | 80 | 83 |
Conclusion
The Unifinepak C18 column, which exhibits sensitivity to carbon-chain branching, combined with fluorescence detection provided sensitive and reproducible analysis of anionic surfactants. At a concentration equivalent to one-tenth of the water-quality standard after 250-fold solid-phase extraction, peak area RSDs were below 2.5% for all components, meeting the specified precision requirement of ≤20%. Five-point calibration curves over 1 to 25 mg/L per component exhibited excellent linearity (r ≥ 0.9997), with measured concentrations ranging from 93% to 107% of the nominal values.
Recovery tests using tap water spiked at 0.004 mg/L per component yielded recoveries above 76% for all five anionic surfactants, within the specified acceptance range of 70% to 130%. These results demonstrate the method’s suitability for determining anionic surfactants in tap water at concentrations relevant to Japan’s Water Supply Act.