
Estimation of the Optimal Excitation Wavelength for Raman Measurements Using Fluorescence Spectra
August 28, 2026 Download This Application
Introduction
Raman microscopy is valued for its ability to reveal molecular fingerprints from very small sample areas, but fluorescence can easily dominate the much weaker Raman signal. When this occurs, useful spectral information may be hidden even when the sample contains measurable Raman-active components.
A practical way to overcome this limitation is to choose an excitation wavelength that avoids strong sample fluorescence. Rather than relying only on repeated Raman trials, JASCO’s dark-field fluorescence observation attachment provides a direct fluorescence pre-screen under LED illumination. The fluorescence spectrum helps identify a laser wavelength with lower fluorescence interference, making Raman method development faster and more reliable.
Experimental
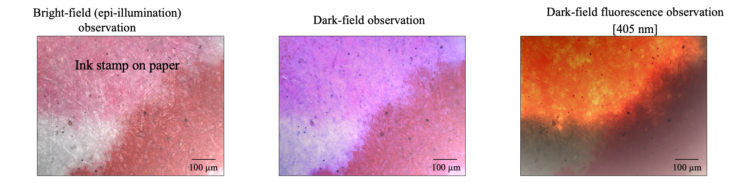
An ink stamp on paper was first examined by Raman spectroscopy using 532 nm excitation. The Raman signal could not be detected because intense fluorescence from the sample overwhelmed the measurement. To understand the source of this interference, the sample area was evaluated using JASCO’s dark-field fluorescence measurement attachment equipped with an LED light source. The fluorescence spectrum was compared with the Raman shift regions expected for 532 nm, 785 nm, and 457 nm excitation. The excitation wavelength predicted to minimize fluorescence was then selected and used for Raman measurements, allowing the effectiveness of the fluorescence-guided approach to be confirmed experimentally.
Sample: Ink stamp (fluorescence emitted at 405 nm excitation)
System
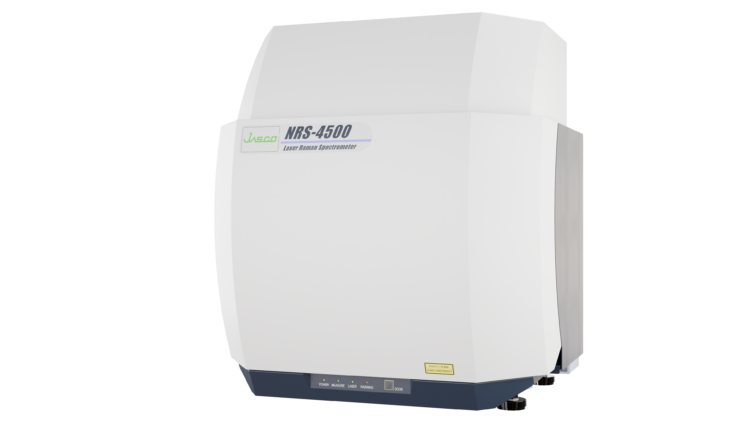
Instrument: NRS-4500 Raman spectrometer
Accessory: RMIX4 MIX observation unit
DFF-405 dark-field fluorescence slide-in attachment
Parameters (Fluorescence spectra)
Excitation wavelength: 405 nm (dark-field fluorescence attachment)
Grating: 900 gr/mm
Rejection filter: 457 nm band-rejection filter
Objective lens: Dark-field long-W.D. objective lens (visible, 20x)
Exposure time: 4 secs
Accumulation: 2
Parameters (Raman spectra)
Excitation wavelength: 532 nm, 785 nm, 457 nm
Objective lens: Dark-field long-W.D. objective lens (visible, 100x)
*Other parameters were optimized for each measurement.
Keywords
Fluorescence, excitation wavelength, Raman spectroscopy, dark-field fluorescence observation, ink stamp, ink, pigment
Results
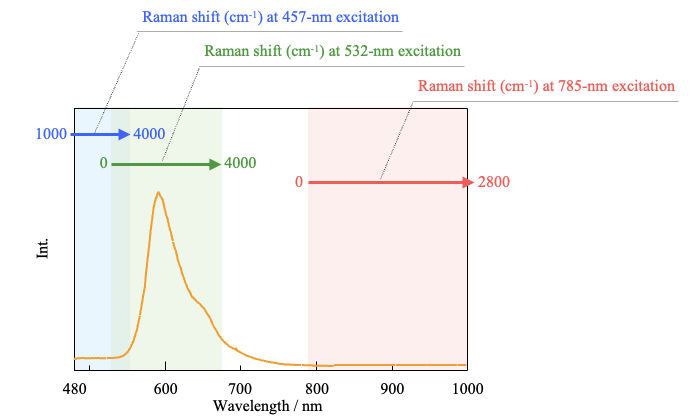
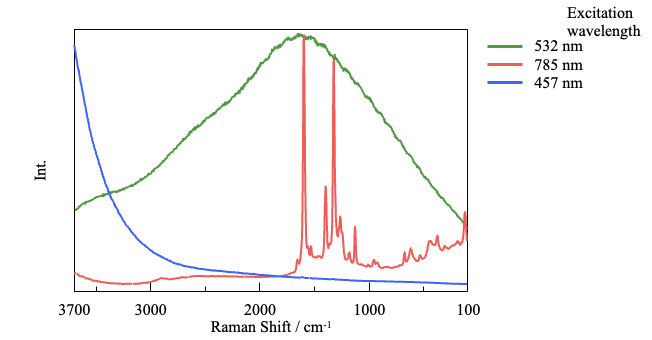
Figure 3 provides a fluorescence map for choosing a Raman excitation wavelength. By comparing the fluorescence spectrum of the ink stamp on paper with the Raman shift regions for 532 nm, 785 nm, and 457 nm excitation, the effect of fluorescence can be predicted before the Raman spectra are acquired. The spectrum indicated that 532 nm excitation would be strongly affected by the fluorescence, while 785 nm excitation is expected to provide a lower-fluorescence condition. Figure 4 confirms this prediction: clear Raman peaks were obtained at 785 nm, whereas peaks were not clearly detected at 532 nm or 457 nm. The observed Raman spectrum is considered to originate from the organic pigment in the ink stamp.
Conclusion
Fluorescence spectra measured with the dark-field fluorescence attachment enabled rational selection of the Raman excitation wavelength for a fluorescence ink-stamp sample. This approach reduces trial and error optimization, guides laser-wavelength selection when adding a new laser and improves measurement efficiency when Raman instruments are shared.