
Evaluation of Polyethylene Terephthalate (PET) Degradation by Molecular Weight Distribution Measurements
November 2, 2026 Download This Application
Introduction
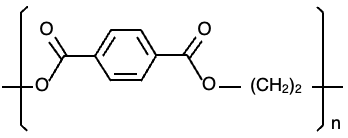
Polyethylene terephthalate (PET) is a polymer widely used in food containers and synthetic fibers. Exposure to ultraviolet light and repeated recycling can cause PET to degrade, affecting its physical properties. Quantitative evaluation of these changes is important for product development and quality control. Gel permeation chromatography (GPC) provides a means of assessing polymer degradation by measuring changes in molecular weight distribution. Hexafluoroisopropanol (HFIP) is commonly used as the eluent for GPC analysis of PET; however, its high cost makes reducing solvent consumption an important consideration. Semi-micro GPC offers an approach to lowering solvent consumption while shortening analysis times.
In this application note, PET test samples were exposed to irradiation in a xenon accelerated weathering tester, and the resulting changes in molecular weight distribution were evaluated using an HFIP-compatible semi-micro GPC system equipped with an RI-4035 refractive index detector and a high-performance analytical GPC column while the changes in color were measured using a UV-Visible spectrophotometer. Data analysis was performed using the molecular weight distribution calculation program in ChromNAV. A calibration curve generated from polymethyl methacrylate (PMMA) standards was used to determine the molecular weight distribution of the degraded PET samples on a PMMA-equivalent basis.
Experimental
LC System
Pump: PU-4185
Autosampler: AS-4150*
Column oven: CO-4060
Detector: RI-4035
*with option units
LC Conditions
Column: GPC LF-404
(4.6 mm I.D. x 250 mm L, 6 µm)
Eluent: 5 mM sodium trifluoroacetate in HFIP
Flow rate: 0.15 mL/min
Column temperature: 40 ºC
Injection volume: 20 µL
UV-Vis System
Instrument: V-750 UV-Vis spectrophotometer
Accessories: ISV-922 Integrating sphere unit
VWCD-960 Color evaluation
(color diagnosis) program
UV-Vis Conditions
Measurement range: 340 nm to 800 nm
Light source: D2/WI
Data interval: 1 nm
Bandwidth: 5 nm
Response: 0.24 sec
Scan speed: 400 nm/min
Accumulations: 1
Sample
Standard samples for creating molecular weight calibration curve
Polymethyl methacrylate (PMMA) mixed sample
(two samples prepared for different molecular weight peaks (Mp))
Standard sample 1: Mp 772,000; 51,900; 6,900; 645
Standard sample 2: Mp 211,000; 21,700; 2,200
Each sample was dissolved and diluted in the mobile phase to 0.025 % (w/v)
Test samples for evaluation
PET test pieces (approximately 10 mm x 10 mm x 2 mm, Standard Test Piece Co., Ltd.)
Keywords
Polyamide 6, PA6, gel permeation chromatography, GPC, molecular weight distribution, molecular weight calibration curve, Polyethylene terephthalate, PET, polymethyl methacrylate, PMMA, hexafluoroisopropanol HFIP, refractive index detector, RI detector E
Results
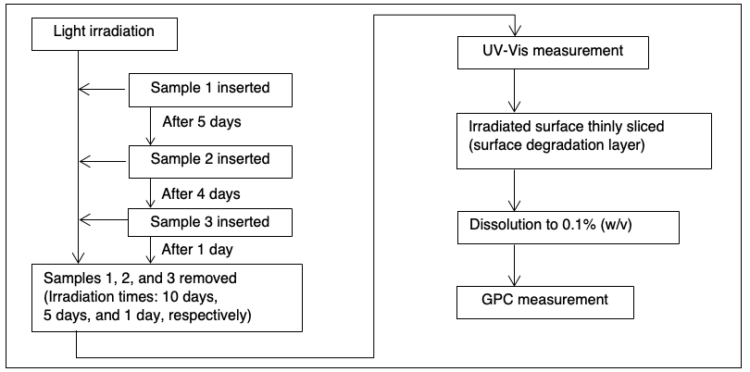
Figure 2 illustrates the photodegradation test procedure. PET test samples were irradiated using a xenon accelerated weathering tester (SOLARBOX 1500e, manufactured by Cofomegra, provided by JASCO INTERNATIONAL Co., Ltd.) at an irradiance of 60 W/m2 and a temperature of 65 °C. Three samples were sequentially introduced into the weathering tester at different times to achieve total irradiation times of 10 days, 5 days, and 1 day for samples 1, 2, and 3, respectively. Following irradiation, the degraded surface layer of each sample was removed using a plane slicer (Slice Master KS-10, provided by JASCO Engineering Co., Ltd.) and dissolved in mobile phase to a concentration of 0.1 % (w/v) for GPC analysis.
The PET test samples changed color from transparent to yellow following irradiation, as shown in Figure 3. The PET test samples were measured using a V-750 UV-Visible spectrophotometer to calculate the color (L*, a*, b*) and yellowness index (YI) to quantitatively evaluate the degree of degradation. Figure 4 shows the chromaticity coordinates of the PET test samples.
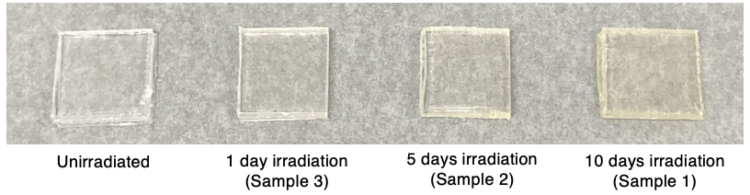
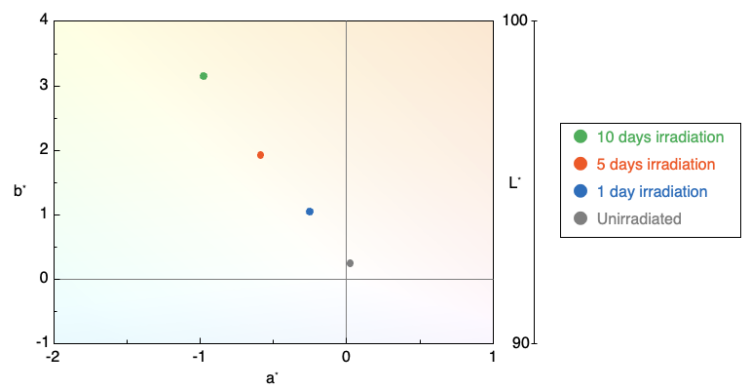
Table 1 summarizes the calculated results for color (L*, a*, b*) and yellowness index (YI), and Figure 5 shows the change in b* and YI with irradiation time.
Table 1. Calculated chromaticity results for PET test samples
| Sample | L* | a* | b* | YI |
|---|---|---|---|---|
| Unirradiated | 95.6 | 0.03 | 0.24 | 0.49 |
| 1 day irradiation | 95.5 | -0.3 | 1.04 | 1.80 |
| 5 days irradiation | 95.5 | -0.6 | 1.93 | 3.22 |
| 10 days irradiation | 95.4 | -1.0 | 3.15 | 5.23 |
YI: JIS K 7373:2006 (Light source: D65, View angle: 2 degrees)
Color matching function: JIS Z 8781-1:2012 (View angle: 2 degrees, Data interval: 1 nm)
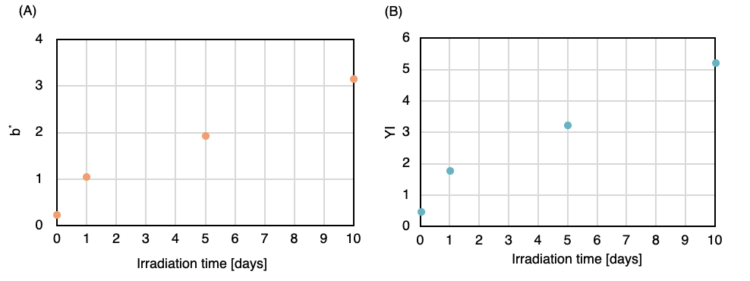
(A) b*; (B) YI
The values of b* and YI increased with irradiation time, confirming the color change of the PET test samples from transparent to yellow. This color change is thought to result from irradiation-induced changes in the chemical structure of PET, which contains aromatic rings with conjugated double bonds, leading to the formation of new conjugated systems.2
Figure 6 shows the chromatograms of the two PMMA standard samples used for the molecular weight calibration. The resulting calibration curve is shown in Figure 7.
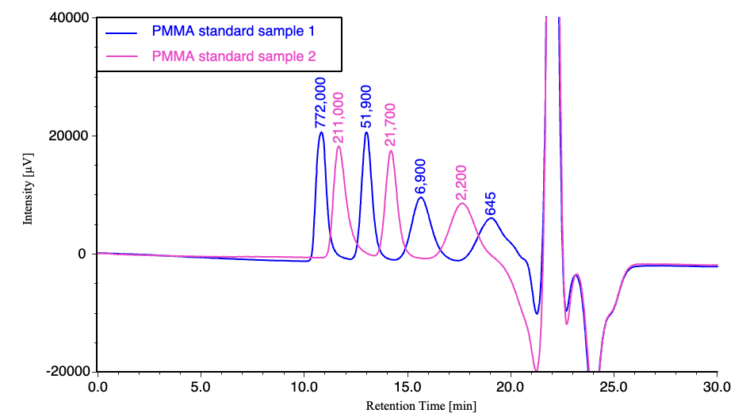
(The values above the peaks represent the Mp for the PMMA standard samples)
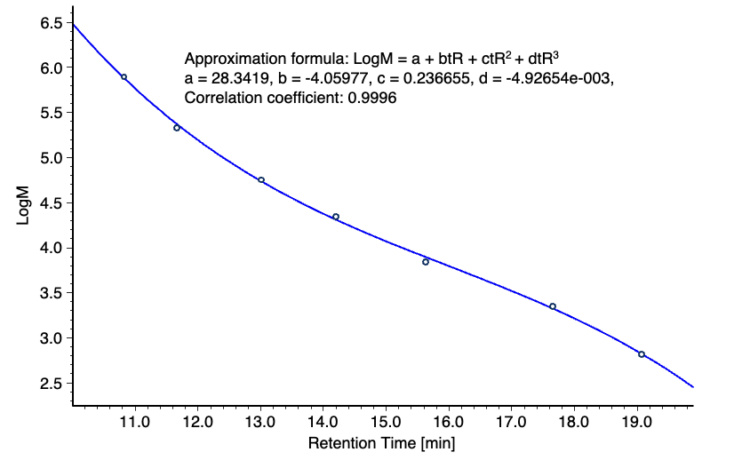
Figure 8 compares the chromatograms of the three irradiated PET samples with that of an unirradiated sample. The corresponding differential molecular weight distribution curves are shown in Figure 9. Molecular weight is plotted on a logarithmic scale to facilitate comparison of the distributions. As irradiation time increased, the peak molecular weight (Mp) decreased, while the high molecular weight tails of the molecular weight distribution increased. These changes indicate that irradiation affected both the position and shape of the molecular weight distribution.
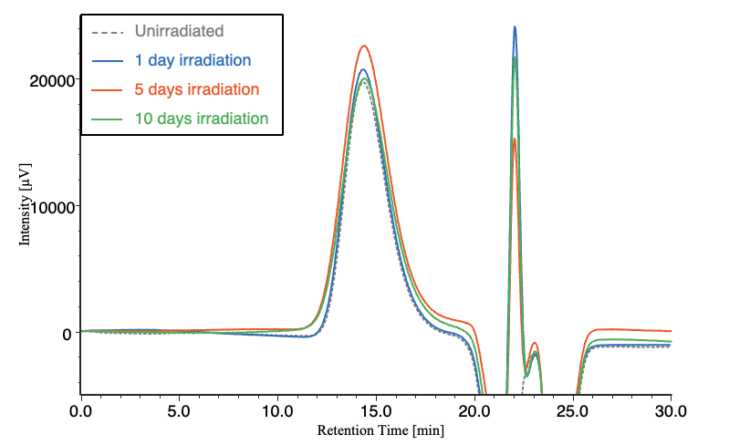
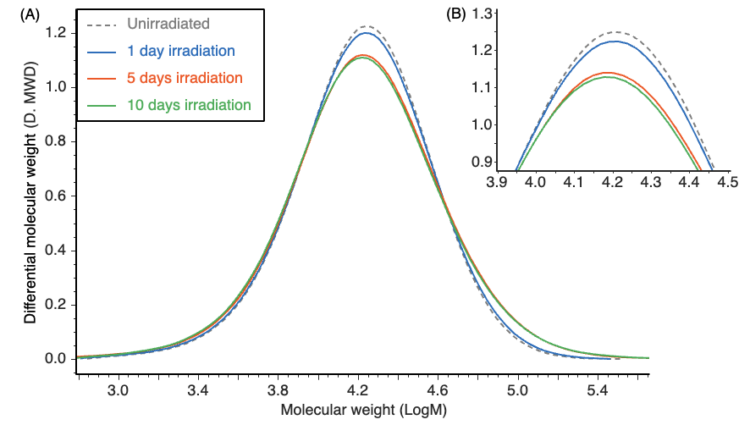
(A) Full curves; (B) Enlarged view of the peak molecular weight (Mp)
Table 2 summarizes the calculated PMMA-equivalent average molecular weight values of the PET test samples. Figure 10 shows the changes in number-average molecular weight (Mn) and weight-average molecular weight (Mw) with irradiation time. As the irradiation time increased, Mp and Mn decreased, whereas Mw increased. This suggests that main chain scission and intermolecular crosslinking occur simultaneously under light irradiation.
Table 2. PMMA-equivalent molecular weight calculation results of the PET test samples
| Sample | Mp | Mn | Mn | Mw/Mn |
|---|---|---|---|---|
| Unirradiated | 18,039 | 10,756 | 19,994 | 1.86 |
| 1 day irradiation | 17,825 | 10,571 | 20,356 | 1.93 |
| 5 days irradiation | 17,511 | 10,136 | 22,421 | 2.21 |
| 10 days irradiation | 17,035 | 10,028 | 23,174 | 2.31 |
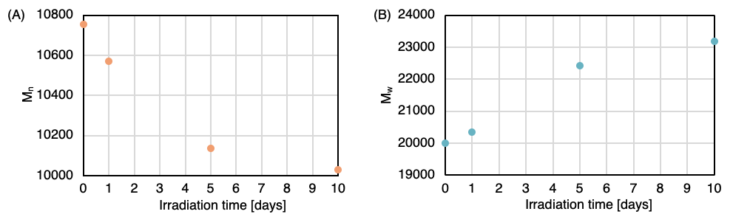
(A) Number-average molecular weight (Mn); (B) Weight-average molecular weight (Mw)
Conclusion
In this application note, the photodegradation of PET test samples irradiated in a xenon accelerated weathering tester was evaluated by combining UV-Visible color measurements with semi-micro GPC analysis of the molecular weight distribution The UV-Vis results indicated a color change from transparent to yellow with increasing irradiation time, as reflected by increases in the color (b*) and yellowness index (YI). GPC analysis revealed decreases in Mp and Mn and an increase in Mw, with increasing irradiation time, suggesting that main chain scission and intermolecular crosslinking occur simultaneously during irradiation. Together, UV-Visible measurements and GPC analysis provide complementary quantitative indicators of changes in PET test samples associated with photodegradation.
References
- JIS K 7373, Plastics – Method for Determining Yellowness and Yellowing (2024)
- Nagano Prefecture Industrial Technology Center Technical Report: N. Shimosato, “Study on Color Changes Due to Photodegradation of Industrial Materials”, No. 16, pp. E13–E17 (2021)