
Evaluation of Polystyrene (PS) Degradation by Molecular Weight Distribution Measurements
October 6, 2026 Download This Application
Introduction
Polystyrene (PS) is a polymer used in a variety of applications, including electronic devices and mechanical components. Exposure to ultraviolet light and repeated recycling can cause PS to degrade, affecting its physical properties. Quantitative evaluation of these changes is important for product development and quality control. Gel permeation chromatography (GPC) provides a means of assessing polymer degradation by measuring changes in molecular weight distribution. Tetrahydrofuran (THF) is commonly used as the eluent for GPC analysis of PS.
In this application note, PS test samples were exposed to irradiation in a xenon accelerated weathering tester, and the resulting changes in molecular weight distribution were evaluated using a GPC system equipped with an RI-4030 refractive index detector and a high-performance analytical GPC column. Data analysis was performed using the molecular weight distribution calculation program in ChromNAV. A calibration curve generated from PS standards was used to determine the molecular weight distribution of the degraded PS samples.
Experimental
Instruments
Pump: PU-4180*
Autosampler: AS-4150
Column oven: CO-4060
Detector: RI-4030
*with option units
LC Conditions
Column: GPC KF-806L (8.0 mm I.D. x 300 mm L, 10 µm)
Eluent: THF (stabilizer-free)
Flow rate: 1.0 mL/min
Column temperature: 40 ºC
Injection volume: 50 µL
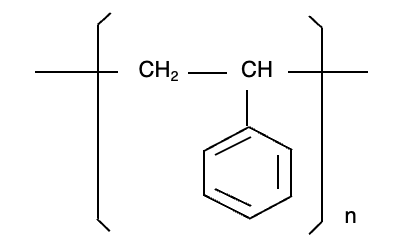
Sample
Standard samples for creating molecular weight calibration curve
PS mixed sample
(two samples prepared for different molecular weight peaks (Mp))
Standard sample 1: Mp 1,470,000; 257,000; 18,100; 3,090
Standard sample 2: Mp 778,000; 64,500; 6,320
Each sample was dissolved and diluted in THF to 0.025% (w/v)
Test samples for evaluation
PS test samples (approximately 3 mm, pellet-shaped, Standard Test Piece Co., Ltd.)
Keywords
PS, polystyrene, GPC, gel permeation chromatography, molecular weight distribution, molecular weight calibration curve, THF, tetrahydrofuran, refractive index detector, RI detector
Results
Figure 2 illustrates the photodegradation test procedure. PC test samples were irradiated using a xenon accelerated weathering tester (SOLARBOX 1500e, manufactured by Cofomegra, provided by JASCO INTERNATIONAL Co., Ltd.) at an irradiance of 60 W/m2 and a temperature of 65 °C. Three samples were sequentially introduced into the weathering tester at different times to achieve total irradiation times of 10 days, 5 days, and 1 day for samples 1, 2, and 3, respectively. Following irradiation, the degraded surface layer of each sample was removed using a plane slicer (Slice Master KS-10, provided by JASCO Engineering Co., Ltd.) and dissolved in THF at a concentration of 0.1% (w/v) for GPC analysis.
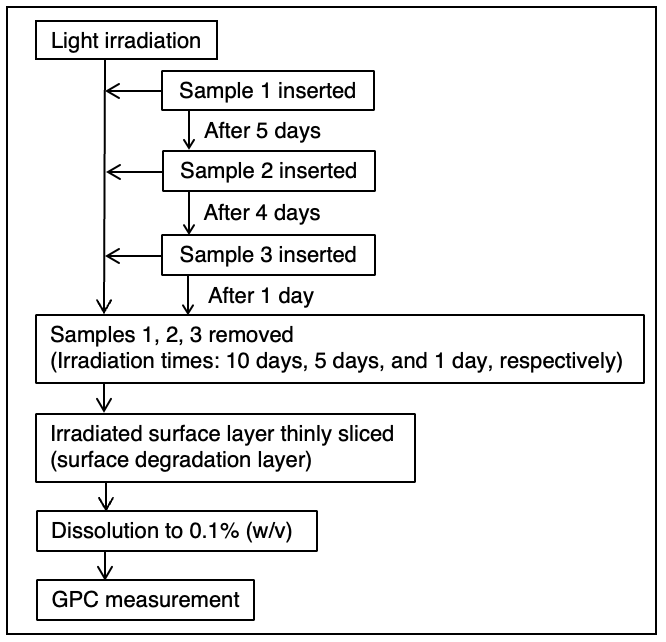
Figure 3 shows the chromatograms of the two PS standard samples used for the molecular weight calibration. The resulting calibration curve is shown in Figure 4.
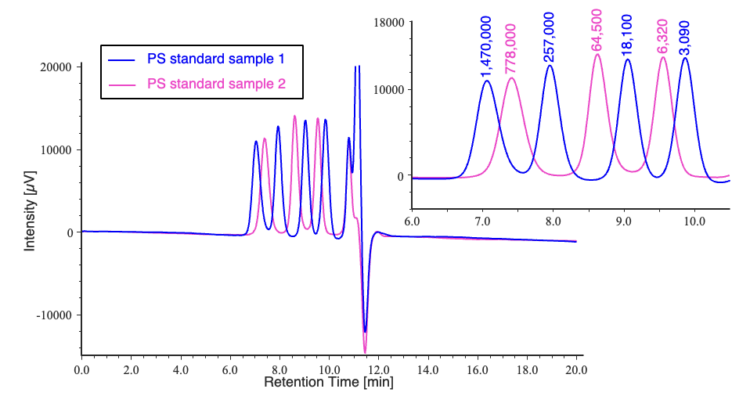
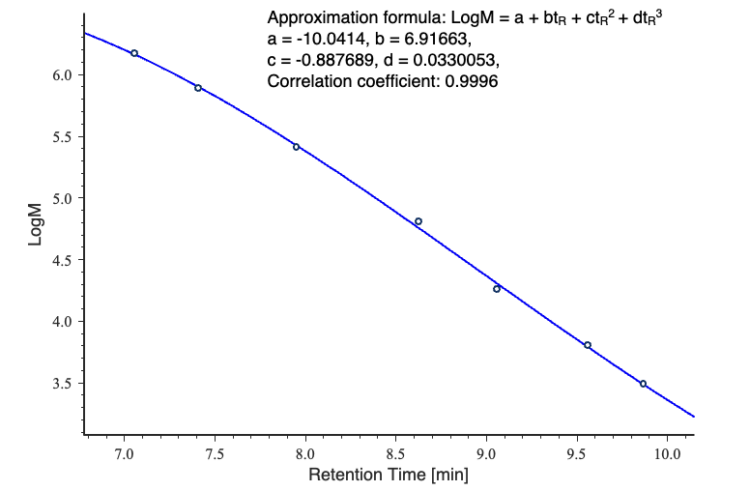
Figure 5 compares the chromatograms of the three irradiated PS samples with that of an unirradiated sample. The corresponding differential molecular weight distribution curves are shown in Figure 6. Molecular weight is plotted on a logarithmic scale to facilitate comparison of the distributions. The curves show a slight shift toward higher molecular weights with increasing irradiation time.
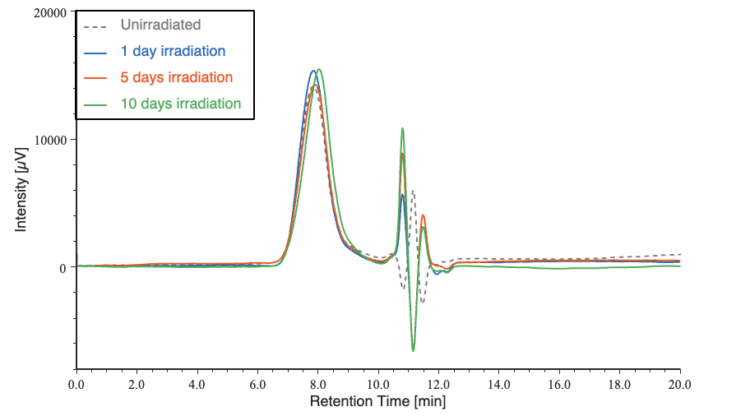
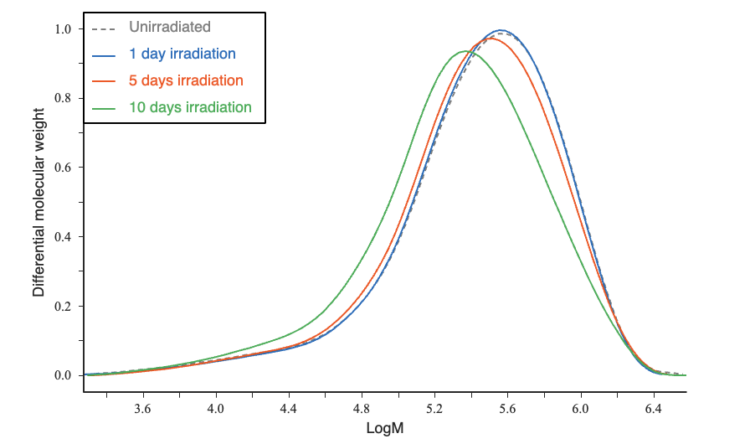
Table 1 summarizes the PS equivalent average molecular weight calculation results. Figure 7 shows the changes in the number-average molecular weight (Mn) and weight-average molecular weight (Mw) as a function of irradiation time.
Table 1. Average molecular weight calculation results for PS test samples
| Sample | Mp | Mn | Mw | Mw/Mn |
|---|---|---|---|---|
| Unirradiated | 335,803 | 116,608 | 419,865 | 3.60 |
| 1 day irradiation | 329,942 | 124,947 | 415,713 | 3.33 |
| 5 days irradiation | 291,401 | 118,069 | 398,665 | 3.38 |
| 10 days irradiation | 218,059 | 93,847 | 339,375 | 3.62 |
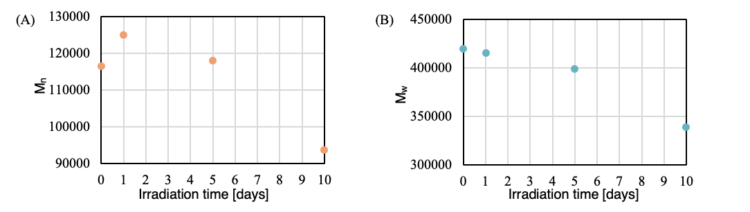
As irradiation time increased, both Mp and Mw decreased, whereas Mn initially increased before decreasing. These trends suggest that early irradiation preferentially promotes the decomposition and volatilization of pre-existing unpolymerized monomers and short-chain oligomers, followed by predominant degradation of the main chain of the polymer.1-3
Conclusion
In this application note, GPC analysis was used to evaluate changes in the molecular weight distribution of PS samples following irradiation in a xenon accelerated weathering tester. As irradiation time increased, Mp and Mw decreased, whereas Mn initially increased before decreasing. These trends suggest that the degradation of residual unpolymerized monomers and short-chain oligomers occur preferentially upon light irradiation, after which the degradation of the main chain becomes dominant. These results demonstrate the utility of molecular weight distribution measurements for quantitatively assessing PS degradation.
References
- N. Meides, T. Menzel, B. Poetzschner, M. J. Löder, U. Mansfeld, P. Strohriegl, V. Altstaedt, J. Senker: Environ. Sci. Technol., 55, 7930 (2021). DOI: 10.1021/acs.est.0c07718
- H. Kimukai, K. Koizumi, H. Taguchi, A. Okabe, K. Takatama, S. Y. Chung, B. G. Kwon, M. Nishimura, S. Mentese, K. Saido: ACS ES&T Water, 2, 1976 (2022). DOI: 10.1021/acsestwater.2c00023
- X. Colin, J. Verdu: C. R. Chim., 9, 1380 (2006). DOI: 10.1016/j.crci.2006.06.004