Quantification Method for Oil and Grease in Water Compliant with ASTM D7575
June 3, 2026 Download This Application
Introduction
In recent years, the release of oil and grease into aquatic ecosystems, such as oceans and rivers, has raised environmental concerns because it can cause ecosystem damage and produce noxious odors. Therefore, determining the concentration of oil and grease in water is important for water quality control. Conventional methods for oil and grease analysis typically involve solvent extraction using substances such as n-hexane, followed by quantification of the extracted sample. However, this procedure is time-consuming and requires solvent handling. As an alternative, ASTM D7575 provides a simpler method for water quality control that does not require hexane extraction. ASTM D7575 uses an oil and grease extractor and calibration standards from Orono Spectral Solutions, Inc.(OSS). This report describes measurement examples performed in accordance with ASTM D7575 using the JASCO FT/IR-4X infrared spectrometer in combination with OSS products. It also describes quantification methods for oil and grease at concentrations lower than those specified in ASTM D7575.
Experimental
Apparatus
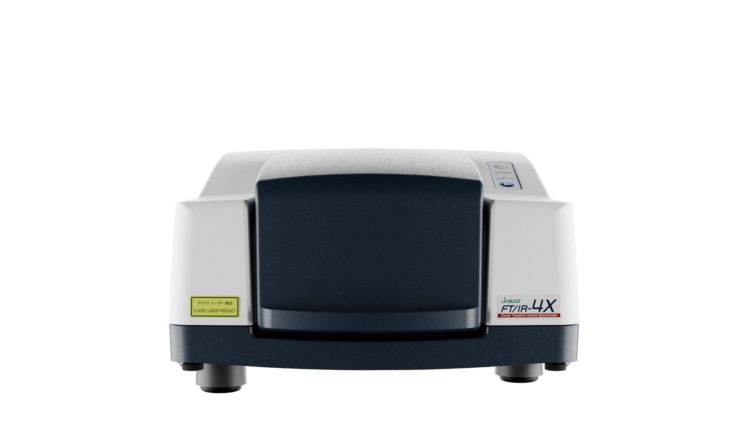
- FT/IR-4X spectrometer (Fig. 1)
- Sample glass bottles – 100 mL
- Ultrasonic bath – Thermostable at 40ºC
- 10 mL Syringe – Luer lock type
- Volumetric flask – 100 mL
Items from OSS Inc.*1
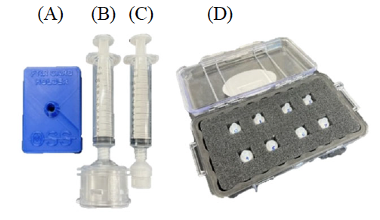
A) FTIR Card Holder
B) 10mL syringe + ø25-mm ClearShotTM extractor
C) 10mL syringe + ø13-mm ClearShotTM extractor
D) Calibration Standard Device Set, 8 Points
FTIR Card Holder (Fig. 2A)
- Holds a ClearShotTM extractor in place
for infrared measurements
ø25 mm and ø13 mm ClearShotTM extractors (Fig. 2B and 2C)
- Contains oil and grease extraction
membrane with luer lock connector
Calibration Standard Device (CSD) Set, 8 points (Fig. 2D)
- Preloaded ClearShotTM extractor certified
oil and grease levels + “blank (CSD No. 0)
Reagents
Laboratory grade water – Deionized
Acetone – ACS, residues less than 1 mg/L
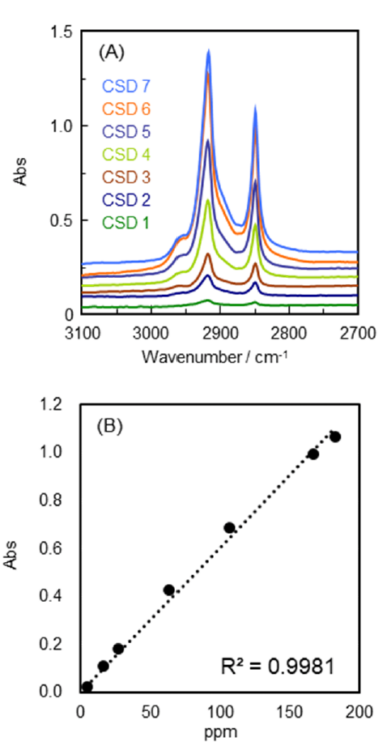
B) Plot of absorbance against concentration, and fitted calibration curve (R2 = 0.9981)
Hexadecane – 98% minimum purity
Stearic acid – 98% minimum purity
*1 JASCO does not provide products of OSS. Please contact your nearest OSS distributor.
Calibration and Standardization
Calibration curves between the concentration of oil and grease and absorbance were created in order to predict the concentration of samples with unknown concentrations.
Procedure 1
1.Measure the infrared spectrum of CSD No. 0 (blank) as a background
2.Measure the infrared spectra of CSD Nos. 1-7 (Fig. 3A)
3.Determine the heights of peaks around at 2920 cm-1 (baseline between 2990 and 2800 cm-1). (Table 1)
4.Plot the peak height against the known concentration and draw the calibration curve. (Fig. 3B)
Results 1
As R2 value of 0.9981 was obtained for the fitted calibration curve. This is fully compliant with ASTM D7575, which specifies
R2 > 0.97. Hereafter, this calibration curve was used to predict the concentration of samples.
Table 1. Results
| CSD No. | Concentration (ppm) | Abs |
|---|---|---|
| 1 | 4.28 | 0.026 |
| 2 | 16.2 | 0.109 |
| 3 | 26.7 | 0.185 |
| 4 | 63.80 | 0.427 |
| 5 | 106.81 | 0.687 |
| 6 | 167.35 | 0.997 |
| 7 | 182.65 | 1.069 |
Determination of Precision and Percent Recovery
Using prepared 40-ppm oil and grease spike solutions, the precision and percent recovery were determined.
Procedure 1 – Preparation of Undiluted Solution of Oil and Grease
- Weigh 400+/-4 mg of hexadecane and 400+/-4 mg of stearic acid in a 100 mL volumetric flask.
- Add acetone (not up to 100 mL).
- Place the flask in an ultrasonic bath at 40 ºC for 20 min to achieve complete dissolution.
- Remove the flask from the bath and leave it to cool to room temperature.
- Add acetone up to 100 mL, and shake the solution to make it homogenous.
- Collect the solution into a sample glass bottle with a PTFE cap.
Procedure 2 – Sample Extraction
- Dilute the undiluted solution in deionized water to make a 40 ppm solution.
- Overfill a 10 mL syringe with >10 mL of the diluted sample and remove bubbles.
- Attach the syringe to the ø25 mm ClearShotTM extractor (upward).
- Filter the 10 mL sample solution through a membrane.
- Discard the filtered solution and dry the extractor in which the sample was captured using dry air.
(Before sample extraction, measure a background infrared spectrum of the extractor.)
Procedure 3 – Infrared Measurements and Analyses

- Attach the well-dried extractor to the FTIR Card Holder.
- Set the holder in the FT/IR and measure the infrared spectrum.
- Determine the peak height and calculate the concentration of the sample using the prepared calibration curve.
(A total of 4 samples were prepared through the above process.)
Results 1 – 3
From the results, the average percent recovery is calculated to be 99.7% with a relative standard deviation of 4.9% (Table 2.2). Compared with the values for ASTM D7575, these results fall well within the limits.
Table 2.1. Results
| Sample No. | Abs | Concentration (ppm) |
|---|---|---|
| 1 | 0.245 | 40.4 |
| 2 | 0.253 | 41.7 |
| 3 | 0.228 | 37.6 |
| 4 | 0.231 | 38.1 |
Table 2.2. Comparison with ASTM D7575
| Average Percent Recovery (%) | Relative Standard Deviation (%) | |
|---|---|---|
| Experimental Value | 99.7 | 4.9 |
| ASTM D7575 | 88-105 | <11 |
Determination of Method Detection Limit (MDL) and Reporting Limit
Using prepared oil and grease spike solutions with a concentration of 4 ppm, the detection limit and reporting limit were determined.
Procedure 4
- Dilute the undiluted sample solution to 4 ppm.
-
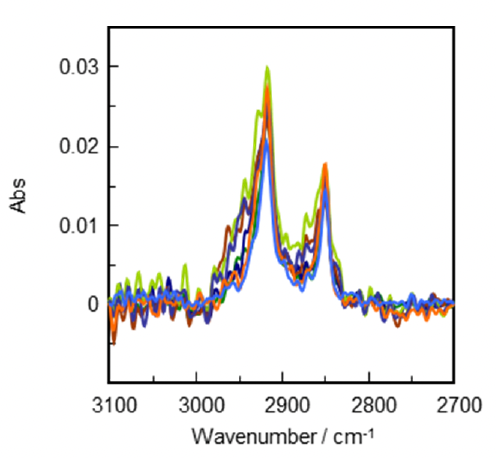
Fig. 6 Infrared spectra of 4 ppm sample solutions (7 samples) Regarding the procedure for sample extraction, infrared measurements and analyses, refer to the previous section.
(A total of 7 samples were prepared through the above process.)
Results 4
Based on these results, the limit of detection (LOD) was calculated to be 1.52 ppm (Fig. 6 and Table. 3), and the lower reporting limit (LRL) was calculated to be 4.84 ppm. Since ASTM D7575 specifies a reporting range of 5-200 ppm, these results meet the requirements of the standard.
Table 3. Results
| Sample No. | Abs | Concentration (ppm) |
|---|---|---|
| 1 | 0.0243 | 4.01 |
| 2 | 0.0258 | 4.25 |
| 3 | 0.0230 | 3.79 |
| 4 | 0.0296 | 4.88 |
| 5 | 0.0255 | 4.20 |
| 6 | 0.0270 | 4.45 |
| 7 | 0.0205 | 3.38 |
Quantification of Lower-Concentration Oil and Grease in Water
In the previous section, experiments performed in accordance with ASTM D7575 were conducted using a Ø 25-mm ClearShotTM extractor. OSS also provides a Ø 13-mm ClearShotTM extractor designed for a determination range of 0.2–40 ppm. Therefore, the Ø 13-mm ClearShotTM extractor was used to quantify oil and grease in water at concentrations below 4 ppm.
Procedure 5
- Prepare a calibration curve for the low-concentration range using CSDs for the ø13-mm ClearShotTM extractor.
- Dilute the undiluted sample solution to 1 ppm. [See previous comment.]
- Regarding the procedure for sample extraction, infrared measurements and analyses, refer to the previous section describing the ø25-mm ClearShotTM.
(A total of 7 samples were prepared through the above process.)
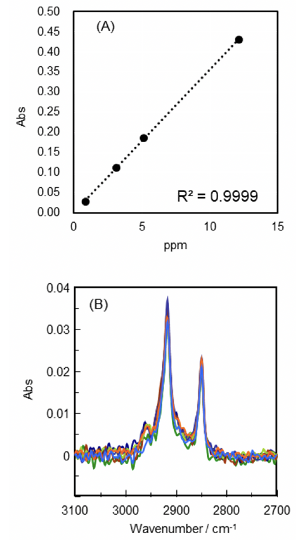
Results 5
The fitted calibration curve generated from the four standard samples showed excellent linearity, with R² = 0.9999 (Fig. 7A). Based on seven sample measurements, the average percentage recovery was 93.6%, with a relative standard deviation of 5.8% (Table 4.2). These results satisfy the ASTM D7575 specification and demonstrate that this method can determine oil and grease in water at concentrations as low as 1 ppm.
Table 4.1. Results
| Sample No. | Abs | Concentration (ppm) |
|---|---|---|
| 1 | 0.0326 | 0.919 |
| 2 | 0.0324 | 0.914 |
| 3 | 0.0347 | 0.978 |
| 4 | 0.0313 | 0.883 |
| 5 | 0.0368 | 1.038 |
| 6 | 0.0329 | 0.928 |
| 7 | 0.0318 | 0.897 |
Table 4.2. Comparison with ASTM D7575
| Average Percent Recovery (%) | Relative Standard Deviation (%) | |
|---|---|---|
| Experimental Value | 93.6 | 5.8 |
| ASTM D7575 | 88-105 | <11 |
Keywords
ASTM D7575, Oil in water, Water Quality control
Conclusion
This report presented an experimental example performed in accordance with ASTM D7575. In addition, the results demonstrated that combining the JASCO FT/IR spectrometer with an alternative extractor enables the quantification of oil and grease in water at concentrations lower than those specified in ASTM D7575.
These findings show that the JASCO FT/IR spectrometer is an effective tool for addressing environmental issues related to oil and grease contamination in water. This approach can also contribute to improved water quality control worldwide.