
Sensitive Analysis of Energy Drinks Using Surface-Enhanced Raman Scattering (SERS)
June 10, 2026 Download This Application
Introduction
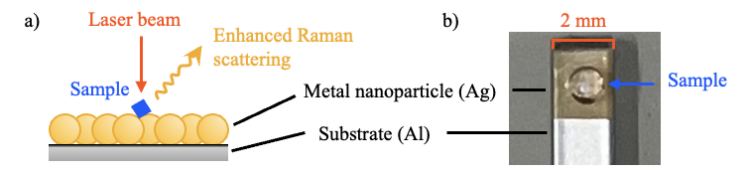
Surface-enhanced Raman scattering (SERS) is a phenomenon in which Raman scattering intensity is significantly enhanced when molecules are adsorbed on the surfaces of metal nanostructures, such as gold or silver nanoparticles (Fig. 1a).1 Raman spectroscopy is widely used for qualitative analysis of samples in the gas, liquid, and solid states; however, because the Raman signal is inherently weak, sensitivity can be a limiting factor, particularly for low-concentration solutions. In contrast to conventional Raman spectroscopy, SERS enables highly sensitive detection of trace constituents and can provide vibrational information for specific molecular species.2
In this study, three energy drinks (A, B, and C) containing trace levels of vitamins (reported as several mol m-3) were analyzed, analytes that are difficult to detect under non-SERS (conventional) measurement conditions. Measurements were performed under both non-SERS and SERS conditions, and the resulting spectra were compared. For the SERS measurements, a SERS substrate coated with metal nanoparticles was used (Fig. 1b).
Experimental
Sample
One drop (a few µL) of three commercial energy drinks (A, B and C) on each substrate
System
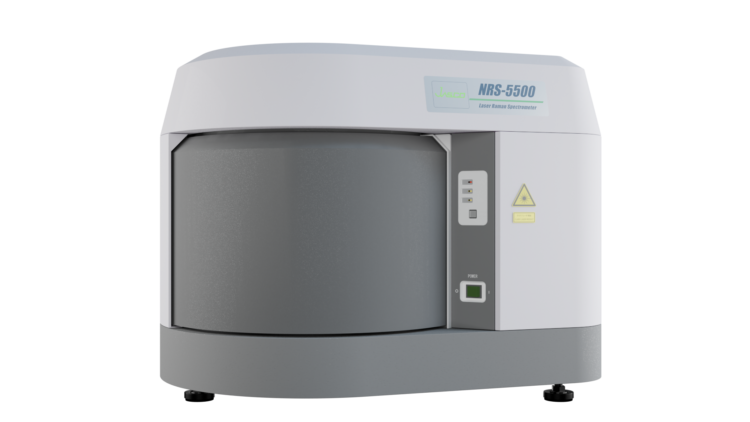
Instrument: NRS-5500 Raman Spectrometer
Parameters
- Non-SERS conditions
Substrate: Liquid/powder holder (8 holes)
Laser wavelength: 532 nm
Laser power: 10.9 mW
- SERS conditions
Substrate: Nano = Kraft AluSERS (ANVOS Analytics)3)
Laser wavelength: 785 nm
Laser power: 0.1 mW (sample A), 1.1 mW (sample B, C)
The optimum values for each sample were set for other parameters.
Non-SERS measurements were performed using the standard excitation wavelength of 532 nm. For the SERS measurements, the excitation wavelength and laser intensity were selected according to the SERS substrate used.
Keywords
SERS, surface enhanced raman scattering, resonance raman spectroscopy, food, raman spectrometer
Results
- Non-SERS conditions
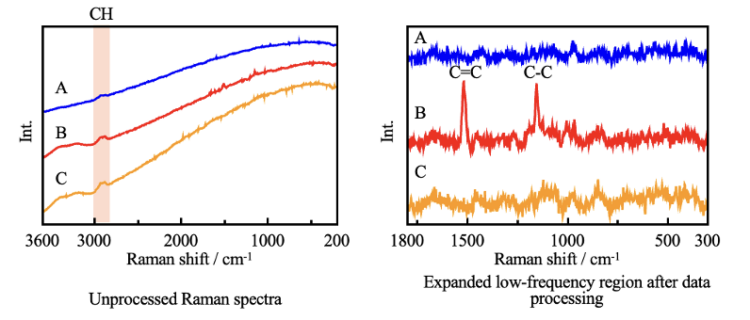
Figure 3 shows Raman spectra measured under non-SERS conditions. For all three samples, a band attributed to C–H vibrations was observed in the 2800 to 3000 cm-1 region, confirming the presence of organic compounds. In sample B only, additional bands were observed at 1518 cm-1 and 1155 cm-1. These bands may be associated with C=C and C–C stretching vibrations4 of β-carotene, which is present only in sample B, and may be enhanced via resonance Raman scattering.a However, based on these spectra alone, it was difficult to clearly distinguish among the three samples.
- SERS conditions
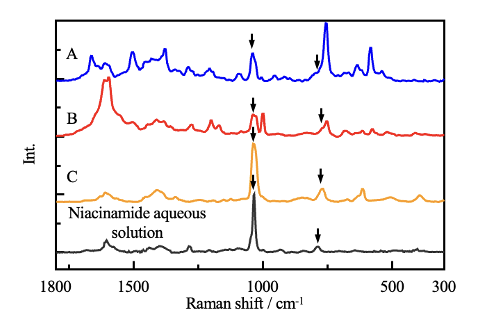
Figure 4 shows the SERS spectra acquired for samples A, B, and C using the SERS substrate, together with the spectrum of an aqueous niacinamide solution (black trace). Niacinamide is a constituent common to all three samples and the reference solution. Similar bands are observed in all spectra at approximately 1040 and 780 cm-1 (arrows). In addition, clear differences are evident near 1600 and 1000 cm-1 bands attributable to aromatic and pyridine-ring vibrations, as well as in the low-wavenumber region below 600 cm-1, enabling discrimination among the samples.
The niacinamide concentration in the energy drinks was low (<1.6 mol m-3), even in the most concentrated sample. These results indicate that SERS enables high-sensitivity detection of low-concentration components that are difficult to observe under non-SERS (conventional) conditions.
Conclusion
The use of SERS enabled highly sensitive detection of niacinamide and other trace constituents in energy drinks at concentrations below a few mol m-3. Measurements were performed using a simple procedure that required only a single drop of sample applied to the substrate.
SERS is expected to enable straightforward, sensitive analysis of chemical structures using sample volumes of only a few microliters (µL) in fields such as pharmaceuticals, food safety, and environmental monitoring.
References
1)H. Hamaguchi, K Iwata (Eds): “Raman Spectroscopy”, P.23 (2015), KODANSHA SCIENTIFIC LTD.
2)Technical Information Institute Co. Ltd.: “Case Studies of Raman Spectroscopy Data Analysis”, 1st edition,pp. 53-60, 334-339 (2022),TECHNICAL INFORMATION INSTITUTE CO. LTD
3)ANVOS Analytics HP: <https://anvos-analytics.com/>, (accessed 2025. 7. 7).
4)L. Lu, L. Shi, J. Secor, R. Alfano: J. Photochem. Photobiol., B, 179, 18 (2017).
DOI: 10.1016/j.jphotobiol.2017.12.022