Quantification of Glucose in Aqueous Solution using Raman Spectroscopy
May 28, 2026 Download This Application
Introduction
Quantitative analysis is widely used in industries such as food and chemical manufacturing for product development, acceptance testing, and quality control. UV-visible (UV-Vis) spectroscopy and infrared (IR) spectroscopy are commonly used techniques for quantitative analysis. However, these methods are generally not suitable for analyzing aqueous solutions containing sugars such as glucose because sugars show no significant absorption bands in the UV-Vis region, and water strongly absorbs in the IR region.1) This report describes an example of quantitative glucose analysis in aqueous solution using Raman spectroscopy. Raman spectroscopy is suitable for sugar analysis because it provides vibrational information from sugars and is less affected by water. Measurements were performed using a Palmtop Raman Spectrometer equipped with an optional cuvette holder.
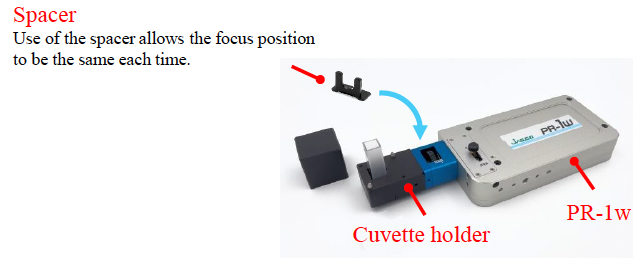
Since there is a proportional relationship between the Raman peak intensity and the concentration of a target component, quantitative analysis can be conducted based on the peak intensity. For quantitative measurements, it is important to set the sample in the same position each time because the laser focus position affects the intensity of the Raman signal. The cuvette holder and the supplied spacer allow for highly reproducible sample positioning and highly accurate focusing, making them useful for quantitative analysis.
In this experiment, a calibration curve was prepared using aqueous glucose solutions with concentrations ranging from 0.5 to 10 wt%.
Experimental
Samples
Aqueous glucose solutions with concentrations of 0.5, 1, 2, 5, and 10 wt% (total of 5 samples)
Ultrapure water (reference)
System
Instrument: PR-1w Palmtop Raman Spectrometer
Accessories: PR-1-C Cuvette holder
Rectangular quartz cell with lid, light path length 10 mm
Parameters
Excitation wavelength: 785 nm
Laser power: 50 mW
Keywords
Quantitative analysis, aqueous solution, glucose, Palmtop Raman spectrometer, Raman spectroscopy
Results
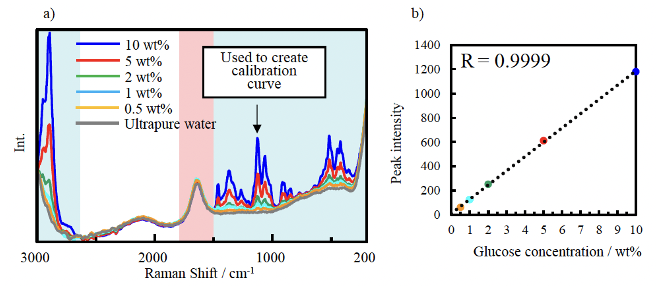
Figure 2a shows the Raman spectra of aqueous glucose solutions at five different concentrations, together with that of ultrapure water. The peak near 1630 cm-1 (pink shaded area), assigned to the bending vibration of water, shows little change in intensity. In contrast, the bands in the blue shaded regions, assigned to glycosidic C-O-C vibrations and C-H bending vibrations in the 200-1500 cm-1 region, as well as C-H stretching vibrations in the 2800-3000 cm-1 region, increase in intensity with increasing glucose concentration. Figure 2b shows a calibration curve created using the intensity of the peak near 1130 cm-1 for glucose concentrations of 0.5 to 10 wt%. The calibration curve showed excellent linearity, with a correlation coefficient of R=0.9999, demonstrating that this system is highly suitable for quantitative analysis of glucose in aqueous solutions within this concentration range.
Conclusion
In this report, we described an example of calibration curve creation for aqueous glucose solutions using Raman spectroscopy. Quantitative analysis can also be applied to other aqueous samples, including solutions of different compounds and inorganic salts, provided that solute-derived Raman peaks are detectable. With the Palmtop Raman Spectrometer, highly accurate quantitative results can be obtained easily by placing a cuvette in the cuvette holder.
References
- 1.H. Ikarashi, Y. Numata, H. Tanaka: The 26th Annual Conference of the Japan Society of Material Cycles and Waste Management, 26, 235 (2015). DOI: 10.14912/jsmcwm.26.0_235