CD Measurement of Protein Film Samples in the Vacuum-UV Region
January 5, 2024
 Download This Application
Introduction
CD spectroscopy is generally considered an essential tool for the secondary structure analysis of proteins. Marker bands for specific secondary structures are most typically observed in the UV region below 260 nm and as far into the far-UV region as possible. It has been widely reported that CD measurements using synchroton radiation have been used to successfully measure spectra down to around 140 nm. While synchrotron radiation has proven to be a very effective method to measure the CD spectra of protein film samples in the vacuum-UV region, it requires access to a limited number of costly facilities.
As an alternative to synchrotron radiation, the J-1500 CD spectrometer has been improved for measurements in the vacuum-UV region. The J-1500’s nitrogen purge efficiency has recently been optimized through computer modelling, the optical system has been enhanced for more light throughput, and new system electronics include digital lockin technology. These features ensure that CD spectra can be obtained from strongly absorbing and high signal-to-noise (S/N) samples across the spectrum and into the vacuum-UV region. The quality of spectral data obtained, including data obtained at shorter wavelengths, substantially improves the accuracy of protein secondary structure analysis.
This application note illustrates the measurement and analysis of a protein film sample in the vacuum-UV region using the J-1500 CD spectrometer.
Experimental
| Measurement conditions | |
|---|---|
| Data acquisition interval | 1 nm |
| Spectral bandwidth | 1 nm |
| Accumulations | 4 times |
| Response time | 4 sec |
| Scan speed | 20 nm/min |
A protein sample in aqueous solution was dropped onto a quartz plate and then evaporated to form a thin film. CD and absorbance spectra were measured in the vacuum-UV region (250-163 nm) for four different protein samples.
Keywords
210-CD-0016, J-1500, Circular Dichroism, CD, vacuum-UV region, protein film, biochemistry
Results
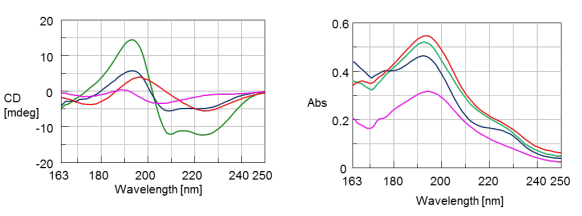
The CD spectra of myglobin (green), lysozyme (red), concanavalin A (blue), and trypsin inhibitor (pink) are shown in Figure 1. Myglobin shows α-helical negative marker bands at 222 and 210 nm while concanavalin A shows a positive band at 195 nm and a negative band at 220 nm indicative of β-sheet structure. Lysozyme illustrates a mixture of both α-helical and β-sheet content with a positive band at 195 nm and two negative maxes around 175 and 222 nm. Trypsin inhibitor shows a random coil structure.
Conclusion
This application note demonstrates that CD measurements obtained in the vacuum-UV region of the spectrum provide reliable data for identifying secondary structure marker bands in a variety of protein samples.
References
Modern Techniques for Circular Dichroism and Synchrotron Radiation Circular Dichroism spectroscopy, B. A. Wallace and R. W. Janes (Eds.), IOS Press, 2009, p 43.
Featured Products:
-
Automated high-throughput screening system for use with the J-1500/1700.
High-Throughput CD
-
UV/Visible/NIR measurements up to 2,500 nm for MCD and specialized applications.
J-1700

CD Measurement of Protein Film Samples in the Vacuum-UV Region
Introduction
CD spectroscopy is generally considered an essential tool for the secondary structure analysis of proteins. Marker bands for specific secondary structures are most typically observed in the UV region below 260 nm and as far into the far-UV region as possible. It has been widely reported that CD measurements using synchroton radiation have been used to successfully measure spectra down to around 140 nm. While synchrotron radiation has proven to be a very effective method to measure the CD spectra of protein film samples in the vacuum-UV region, it requires access to a limited number of costly facilities.
As an alternative to synchrotron radiation, the J-1500 CD spectrometer has been improved for measurements in the vacuum-UV region. The J-1500’s nitrogen purge efficiency has recently been optimized through computer modelling, the optical system has been enhanced for more light throughput, and new system electronics include digital lockin technology. These features ensure that CD spectra can be obtained from strongly absorbing and high signal-to-noise (S/N) samples across the spectrum and into the vacuum-UV region. The quality of spectral data obtained, including data obtained at shorter wavelengths, substantially improves the accuracy of protein secondary structure analysis.
This application note illustrates the measurement and analysis of a protein film sample in the vacuum-UV region using the J-1500 CD spectrometer.
Experimental
| Measurement conditions | |
|---|---|
| Data acquisition interval | 1 nm |
| Spectral bandwidth | 1 nm |
| Accumulations | 4 times |
| Response time | 4 sec |
| Scan speed | 20 nm/min |
A protein sample in aqueous solution was dropped onto a quartz plate and then evaporated to form a thin film. CD and absorbance spectra were measured in the vacuum-UV region (250-163 nm) for four different protein samples.
Results
The CD spectra of myglobin (green), lysozyme (red), concanavalin A (blue), and trypsin inhibitor (pink) are shown in Figure 1. Myglobin shows α-helical negative marker bands at 222 and 210 nm while concanavalin A shows a positive band at 195 nm and a negative band at 220 nm indicative of β-sheet structure. Lysozyme illustrates a mixture of both α-helical and β-sheet content with a positive band at 195 nm and two negative maxes around 175 and 222 nm. Trypsin inhibitor shows a random coil structure.
Conclusion
This application note demonstrates that CD measurements obtained in the vacuum-UV region of the spectrum provide reliable data for identifying secondary structure marker bands in a variety of protein samples.
Keywords
210-CD-0016, J-1500, Circular Dichroism, CD, vacuum-UV region, protein film, biochemistry
References
Modern Techniques for Circular Dichroism and Synchrotron Radiation Circular Dichroism spectroscopy, B. A. Wallace and R. W. Janes (Eds.), IOS Press, 2009, p 43.