Measurement of Enzyme Kinetics by UV-Visible Spectroscopy and Advanced Calculations
January 5, 2024
Introduction
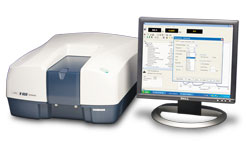
Enzyme activity is frequently investigated in the medicinal, biochemistry, and food science research fields to elucidate the rate of which reaction occurs and the affinity of the enzyme-substrate interactions. The rates of these reactions can be accurately measured using a UV-Visible spectrophotometer. When an enzyme (E) binds with a substrate (S), an intermediate or enzyme/substrate complex (ES) is produced, which can further react and yield a by-product (P), shown in Scheme 1. This biproduct can be quantified and observed by monitoring its maximum absorption wavelength.
![]()
The Michaelis-Menten expression is commonly used to describe the rate (v) of the enzyme reaction.
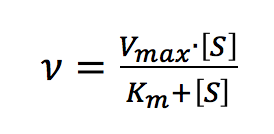
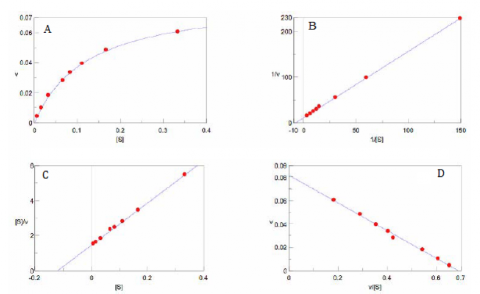
With increasing substrate concentrations [S], the enzyme reactivity will asymptotically approach its maximum velocity [Vmax]. The [Km] value is defined by the substrate concentration at half-maximum velocity Vmax /2. This [Km] value is referred to as the Michaelis-Menten constant. Based on the equation (1), a saturation curve illustrated by a Michaelis-Menten plot in Figure 2, describes the relation between the substrate concentration [S] and velocity [V]. The [Vmax] and [Km] values can then be determined by the plot of the substrate concentration and velocity values derived from a series of experimental determinations of the enzyme activity. Larger values of [Vmax] denote a higher maximum activity. The [Km] value represents the affinity of the enzyme for the substrate. Smaller values of [Km] indicate that the enzyme and substrate are tightly bound and form the ES complex more quickly. On the other hand, larger values of the [Km] indicate that the components are loosely bound and form the ES complex more slowly.
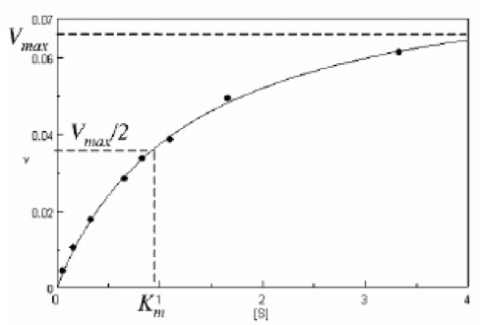
Determination of the [Vmax] and [Km] values by visual interpretation of the Michaelis-Menten plot can result in errors for the kinetics values. Therefore, linearized plots that can be calculated from variations of equation (1) are preferred to determine the values. The Lineweaver-Burk, Hofstee, and Eadie plots are expressed as linear plots of the same data derived from the enzyme kinetics reactions. The [Vmax] and [Km] values can then be determined by the slope and the intercepts of the vertical and horizontal axes of these plots, offering greater accuracy.
Taking the reciprocal of the Michaelis-Menten equation gives:

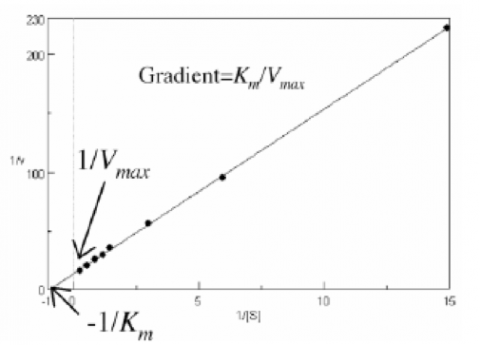
Plotting 1/v as a function of 1/[S] is known as the Lineweaver-Burk plot (Figure 2). The slope (a) and intercept (b) of the linear curve is then calculated by the least-squares method and [Vmax] and [Km] values can be calculated by the following equations:


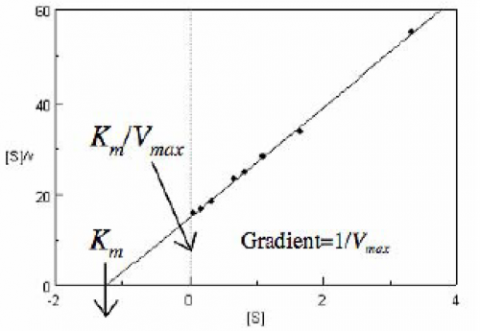
The Hofstee Plot is shown in Figure 3 and is described by the following equation:

where [S]/v is plotted as a function of [S]. The slope (a) and intercept (b) of the linear curve is then calculated by the least-squares method and [Vmax] and [Km] values can be calculated by the following equations:


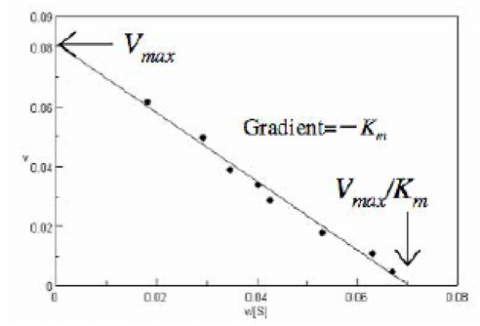
The Eadie Plot is shown in Figure 4 and is described by the following equation:

where [V] is plotted as a function of v/[S]. The slope (a) and intercept (b) of the linear curve is then calculated by the least-squares method and [Vmax] and [Km] values can be calculated by the following equations:


The Lineweaver-Burk plot is most useful when the enzymatic reaction has a smaller substrate concentration while Hofstee plots are best used for larger substrate concentrations. Eadie plots can be used for a variety of substrate concentrations.
When alkaline phosphatase (ALP) reacts with p-nitrophenylphosphate, inorganic phosphate and p-nitrophenol compounds are produced. The p-nitrophenol has a stable yellow color in an alkaline solution. This application note will describe how to determine the substrate concentration, [S], and velocity, v, using the absorption maximum of p-nitrophenol.
Experimental
The enzyme (0.0004 μg/mL of alkaline phosphate in 0.9 g/L of NaCl) was mixed with a 0.1 M carbonate buffer solution (27.5 mg of Na2CO3 and 22.5 mg of NaHCO3) and 10 mM magnesium chloride to create the enzyme solution. The initial p-nitrophenylphosphate substrate solutions were 0.067, 0.167, 0.333, 0.337, 0.833, 1.11, 1.67, 3.33 mmol/L and final concentrations were 0.0067, 0.0167, 0.0333, 0.0667, 0.0833, 0.111, 0.167, 0.333 mmol/L when mixed with the enzyme solution.
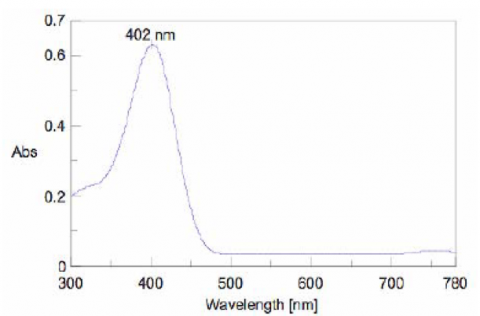
To determine the absorption maximum of p-nitrophenol, 0.667 mM of the substrate solution was added to the enzyme solution. The absorption spectrum was measured after allowing the reactants to react for 2000 seconds. The absorption maximum was observed at 402 nm (Figure 5). The ALP activity in the subsequent experiments was determined by monitoring the 402 nm absorption peak.
To experimentally determine the Km and Vmax values, a blank spectrum was measured with 1.5 mL of 0.1 M carbonate buffer solution, 0.3 mL of 10 mM magnesium chloride solution, and 0.9 mL of the enzyme solution in a 10 mm pathlength cell. For the sample measurement, shortly after the start of the measurement 0.067 mL of the substrate solution was injected into the sample cell. Both the blank and sample measurements were repeated for different substrate concentrations.
| Measurement Conditions | |||
| Measurement Range | 0-2000 seconds | Data Interval | 1 second |
| Bandwidth | 2.0 nm | Response | Medium |
| Wavelength | 402 nm | Temperature | 37°C |
Keywords
210-UV-0029, V-650, UV-Visible/NIR, calibration curve, quantitative, Biochemistry, Kinetics, Enzyme, STR-707 Water Thermostatted Cell Holder with Stirrer, CSP-478 Sample holder
Results
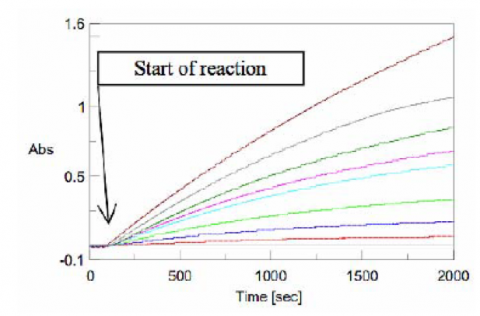
Figure 6 shows the results of the Time Course measurements for each substrate concentration. The gradient after the start of the reaction was calculated as the velocity, v, shown in Table 1.
Table 1. Substrate concentrations [S] and velocity v.
| [S] mmol/L | v abs/min | |
| Red | 0.0067 | 0.004 |
| Purple | 0.0167 | 0.010 |
| Green | 0.0333 | 0.018 |
| Light Blue | 0.0667 | 0.028 |
| Pink | 0.0833 | 0.034 |
| Dark Green | 0.111 | 0.039 |
| Grey | 0.167 | 0.048 |
| Brown | 0.333 | 0.061 |
The results were plotted using the Michaelis-Menten, Lineweaver-Burk, Hofstee, and Eadie algorithms, and the [Vmax] and [Km] values were calculated based on the reaction kinetics. These values are shown in Table 2. For the Michaelis-Menten values, [Vmax] and [Km] values were initially calculated by the Eadie plot and the calculated values were taken as the initial values. The measured v and calculated v from equation 1 were fitted by the least-square method to calculate the final [Vmax] and [Km] values.
Table 2. Results of the varying kinetic analyses.
| Michaelis-Menten | Lineweaver-Burk | Hofstee | Eadie | |
| Vmax | 0.0835 | 0.0815 | 0.0828 | 0.0818 |
| Km | 0.1238 | 0.1179 | 0.1212 | 0.1187 |
| Eqn. | 0.0333 | 1/v = 1.447 x 1/[S] + 12.27 | [S]/v = 12.0721 x [S] - 1.4632 | v = -0.01187 x v/[S] + 0.08185 |
Featured Products:
-
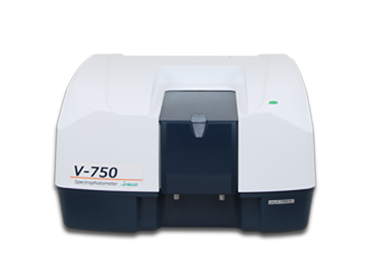
A high resolution UV-Visible double-beam spectrophotometer with single monochromator, variable SBW and PMT detector
V-750 UV-Visible Spectrophotometer
-
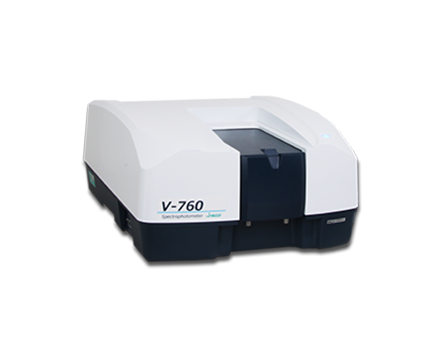
A high resolution UV-Visible double-beam, double-monochromator spectrophotometer with exceptional stray light and absorbance linearity
V-760 UV-Visible Spectrophotometer
-
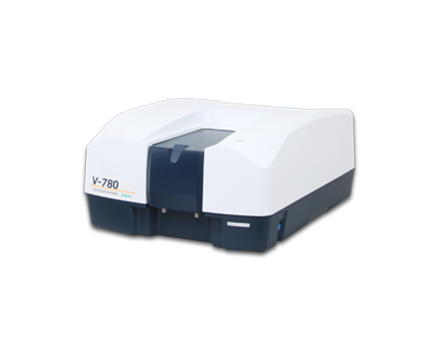
A high sensitivity UV-Visible/NIR Spectrophotometer with InGaAs detector for wavelengths up to1600nm
V-780 UV-Visible/NIR Spectrophotometer

Measurement of Enzyme Kinetics by UV-Visible Spectroscopy and Advanced Calculations
Introduction

Enzyme activity is frequently investigated in the medicinal, biochemistry, and food science research fields to elucidate the rate of which reaction occurs and the affinity of the enzyme-substrate interactions. The rates of these reactions can be accurately measured using a UV-Visible spectrophotometer. When an enzyme (E) binds with a substrate (S), an intermediate or enzyme/substrate complex (ES) is produced, which can further react and yield a by-product (P), shown in Scheme 1. This biproduct can be quantified and observed by monitoring its maximum absorption wavelength.
![]()
The Michaelis-Menten expression is commonly used to describe the rate (v) of the enzyme reaction.

With increasing substrate concentrations [S], the enzyme reactivity will asymptotically approach its maximum velocity [Vmax]. The [Km] value is defined by the substrate concentration at half-maximum velocity Vmax /2. This [Km] value is referred to as the Michaelis-Menten constant. Based on the equation (1), a saturation curve illustrated by a Michaelis-Menten plot in Figure 2, describes the relation between the substrate concentration [S] and velocity [V]. The [Vmax] and [Km] values can then be determined by the plot of the substrate concentration and velocity values derived from a series of experimental determinations of the enzyme activity. Larger values of [Vmax] denote a higher maximum activity. The [Km] value represents the affinity of the enzyme for the substrate. Smaller values of [Km] indicate that the enzyme and substrate are tightly bound and form the ES complex more quickly. On the other hand, larger values of the [Km] indicate that the components are loosely bound and form the ES complex more slowly.

Determination of the [Vmax] and [Km] values by visual interpretation of the Michaelis-Menten plot can result in errors for the kinetics values. Therefore, linearized plots that can be calculated from variations of equation (1) are preferred to determine the values. The Lineweaver-Burk, Hofstee, and Eadie plots are expressed as linear plots of the same data derived from the enzyme kinetics reactions. The [Vmax] and [Km] values can then be determined by the slope and the intercepts of the vertical and horizontal axes of these plots, offering greater accuracy.
Taking the reciprocal of the Michaelis-Menten equation gives:


Plotting 1/v as a function of 1/[S] is known as the Lineweaver-Burk plot (Figure 2). The slope (a) and intercept (b) of the linear curve is then calculated by the least-squares method and [Vmax] and [Km] values can be calculated by the following equations:


The Hofstee Plot is shown in Figure 3 and is described by the following equation:

where [S]/v is plotted as a function of [S]. The slope (a) and intercept (b) of the linear curve is then calculated by the least-squares method and [Vmax] and [Km] values can be calculated by the following equations:


The Eadie Plot is shown in Figure 4 and is described by the following equation:

where [V] is plotted as a function of v/[S]. The slope (a) and intercept (b) of the linear curve is then calculated by the least-squares method and [Vmax] and [Km] values can be calculated by the following equations:


The Lineweaver-Burk plot is most useful when the enzymatic reaction has a smaller substrate concentration while Hofstee plots are best used for larger substrate concentrations. Eadie plots can be used for a variety of substrate concentrations.
When alkaline phosphatase (ALP) reacts with p-nitrophenylphosphate, inorganic phosphate and p-nitrophenol compounds are produced. The p-nitrophenol has a stable yellow color in an alkaline solution. This application note will describe how to determine the substrate concentration, [S], and velocity, v, using the absorption maximum of p-nitrophenol.
Experimental
The enzyme (0.0004 μg/mL of alkaline phosphate in 0.9 g/L of NaCl) was mixed with a 0.1 M carbonate buffer solution (27.5 mg of Na2CO3 and 22.5 mg of NaHCO3) and 10 mM magnesium chloride to create the enzyme solution. The initial p-nitrophenylphosphate substrate solutions were 0.067, 0.167, 0.333, 0.337, 0.833, 1.11, 1.67, 3.33 mmol/L and final concentrations were 0.0067, 0.0167, 0.0333, 0.0667, 0.0833, 0.111, 0.167, 0.333 mmol/L when mixed with the enzyme solution.
To determine the absorption maximum of p-nitrophenol, 0.667 mM of the substrate solution was added to the enzyme solution. The absorption spectrum was measured after allowing the reactants to react for 2000 seconds. The absorption maximum was observed at 402 nm (Figure 5). The ALP activity in the subsequent experiments was determined by monitoring the 402 nm absorption peak.

To experimentally determine the Km and Vmax values, a blank spectrum was measured with 1.5 mL of 0.1 M carbonate buffer solution, 0.3 mL of 10 mM magnesium chloride solution, and 0.9 mL of the enzyme solution in a 10 mm pathlength cell. For the sample measurement, shortly after the start of the measurement 0.067 mL of the substrate solution was injected into the sample cell. Both the blank and sample measurements were repeated for different substrate concentrations.
| Measurement Conditions | |||
| Measurement Range | 0-2000 seconds | Data Interval | 1 second |
| Bandwidth | 2.0 nm | Response | Medium |
| Wavelength | 402 nm | Temperature | 37°C |
Results

Figure 6 shows the results of the Time Course measurements for each substrate concentration. The gradient after the start of the reaction was calculated as the velocity, v, shown in Table 1.
Table 1. Substrate concentrations [S] and velocity v.
| [S] mmol/L | v abs/min | |
| Red | 0.0067 | 0.004 |
| Purple | 0.0167 | 0.010 |
| Green | 0.0333 | 0.018 |
| Light Blue | 0.0667 | 0.028 |
| Pink | 0.0833 | 0.034 |
| Dark Green | 0.111 | 0.039 |
| Grey | 0.167 | 0.048 |
| Brown | 0.333 | 0.061 |
The results were plotted using the Michaelis-Menten, Lineweaver-Burk, Hofstee, and Eadie algorithms, and the [Vmax] and [Km] values were calculated based on the reaction kinetics. These values are shown in Table 2. For the Michaelis-Menten values, [Vmax] and [Km] values were initially calculated by the Eadie plot and the calculated values were taken as the initial values. The measured v and calculated v from equation 1 were fitted by the least-square method to calculate the final [Vmax] and [Km] values.
Table 2. Results of the varying kinetic analyses.
| Michaelis-Menten | Lineweaver-Burk | Hofstee | Eadie | |
| Vmax | 0.0835 | 0.0815 | 0.0828 | 0.0818 |
| Km | 0.1238 | 0.1179 | 0.1212 | 0.1187 |
| Eqn. | 0.0333 | 1/v = 1.447 x 1/[S] + 12.27 | [S]/v = 12.0721 x [S] - 1.4632 | v = -0.01187 x v/[S] + 0.08185 |

Keywords
210-UV-0029, V-650, UV-Visible/NIR, calibration curve, quantitative, Biochemistry, Kinetics, Enzyme, STR-707 Water Thermostatted Cell Holder with Stirrer, CSP-478 Sample holder

 Download This Application