Simultaneous Monitoring of Greenhouse Gases with FTIR
May 1, 2024
 Download This Application
Introduction
Stable gases such as carbon dioxide, methane, halogenated carbon compounds, have a considerable impact on global warming and are termed ‘greenhouse gases’. On the other hand, nitrogen and sulfur compounds, and volatile oxygenated carbon (VOC) gases are quite reactive and are regarded as pollutants that cause photochemical oxidation, smog and the worsening of indoor environments.
Many gases used in the manufacturing processes of semiconductors are also harmful and strict control and monitoring of these gases is required. It is important to monitor the different classes of gases to evaluate their impact on the environment. One of the features of a newly developed program dedicated to IR gas analysis system is to be able to analyze similar multi-component compounds simultaneously using a calculation based on subtracted spectra. In addition, Time Course Measurement makes it possible to perform continuous and on-line monitoring of these noxious gases.
Features of the continuous quantitative analysis program for multiple components:
- Simultaneous quantitative analysis of up to 50 components
- Continuous measurement for up to 40 days
- Replaceable calibration curve on an ‘as-needed’ basis
- Open-Path measurement capability
Instruments
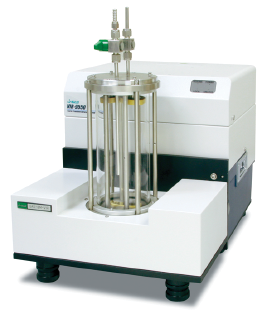
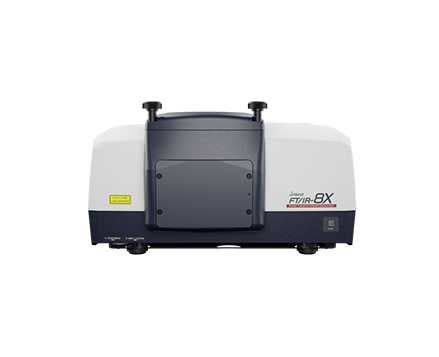
The multicomponent quantitation program can be used with both the VIR Series and FT/IR-4000/6000 Series instruments. The compact and portable VIR series is useful for sample monitoring for a wide range of industrial purposes such as outdoor or clean room applications because it can be easily transported and installed. Full vacuum FTIR systems can provide excellent quantitative analysis of carbon dioxide and water vapor in air with a high degree of accuracy. Gas cells with path lengths from 10 cm to 20 meters are available and a suitable cell can be selected depending upon the required gas concentrations.
Experimental
Measurement Example 1
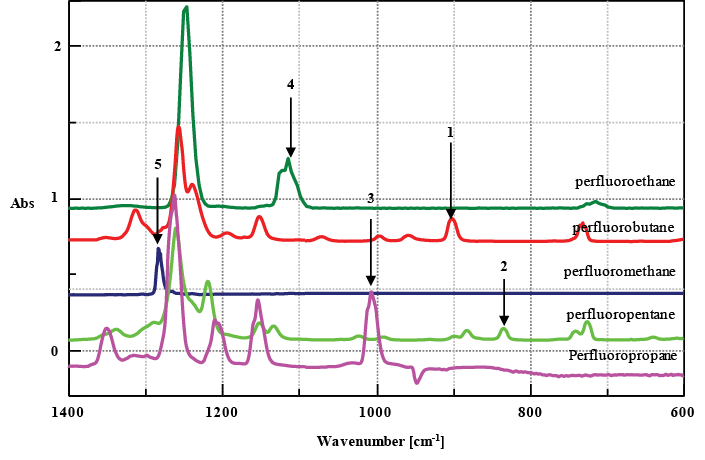
Figure 2 shows the standard spectra of several perfluorocarbon compounds (PFC), identified as greenhouse gases. The absorption peaks in the infrared spectra are observed in a very narrow wavenumber range due to their similar chemical structures. Of particular interest is perfluoromethane, with an absorption peak at 1280 cm-1, which overlaps with an absorption peak of perfluoropentane. In cases like these, it is difficult to set a single quantitative peak for reliable analysis. For example, when the 5 different gases outlined in Figure 2 are quantified, the accuracy in quantitation can be improved by estimating each gas concentration in order from No. 1 to No. 5 as shown in the figure and subtracting a calculated spectrum for each component based on the estimated concentration in series from the measured spectra. A single peak can be set by the quantitative analysis program at a specific position (highlighted by an arrow in the figure), according to the number. This allows the quantitative analysis of the perfluoromethane concentration. Multivariate analysis makes it possible to perform quantitative analysis even where there is no single analyte peak. However, this may not be practical as it is necessary to prepare many standard concentrations of mixtures and the quantitative accuracy may suffer at low concentrations. By contrast, the spectra of hydrofluorocarbons (HFC) have more analyte peaks than those of PFC compounds. Therefore, a continuous measurement program for multiple components using subtracted spectra may be more effective. It should be noted that conventional methods for quantitative analysis of multiple gases can be difficult and the outlined approach may have more success in these cases.
Measurement Example 2

Figure 3 Spectra of formaldehyde, acetaldehyde, toluene and acetic acid are provided as examples of compounds that can cause ‘sick building’ syndrome or simple air pollution. The absorption peaks of formaldehyde and acetaldehyde overlap with the formaldehyde peaks obscured by the broad absorption band of acetaldehyde. In this example, the concentration for acetic acid (No. 1) is estimated using the peak at 1290 cm-1. After subtracting the amount of acetic acid, acetaldehyde (No. 2) is calculated using the 1110 cm-1 peak. Finally, the ‘hidden’ peak of formaldehyde is determined using the peak at 1745 cm-1. For these complicated quantitative determinations, if the order of the components is evaluated and set in advance, all components can be calculated automatically and simultaneously, and using a ‘Time Course Measurement’ program it possible to perform continuous monitoring with resulting calculated concentrations.
Keywords
230-TR-0201, air pollution, gas analysis, FTIR, formaldehyde, HC0H, acetaldehyde, perflurorocarbon, perfluoromethane, perfluoropentane, PFC, sick building syndrome, time course FTIR measurement
Featured Products:


Simultaneous Monitoring of Greenhouse Gases with FTIR
Introduction
Stable gases such as carbon dioxide, methane, halogenated carbon compounds, have a considerable impact on global warming and are termed ‘greenhouse gases’. On the other hand, nitrogen and sulfur compounds, and volatile oxygenated carbon (VOC) gases are quite reactive and are regarded as pollutants that cause photochemical oxidation, smog and the worsening of indoor environments.
Many gases used in the manufacturing processes of semiconductors are also harmful and strict control and monitoring of these gases is required. It is important to monitor the different classes of gases to evaluate their impact on the environment. One of the features of a newly developed program dedicated to IR gas analysis system is to be able to analyze similar multi-component compounds simultaneously using a calculation based on subtracted spectra. In addition, Time Course Measurement makes it possible to perform continuous and on-line monitoring of these noxious gases.
Features of the continuous quantitative analysis program for multiple components:
- Simultaneous quantitative analysis of up to 50 components
- Continuous measurement for up to 40 days
- Replaceable calibration curve on an ‘as-needed’ basis
- Open-Path measurement capability
Instruments
The multicomponent quantitation program can be used with both the VIR Series and FT/IR-4000/6000 Series instruments. The compact and portable VIR series is useful for sample monitoring for a wide range of industrial purposes such as outdoor or clean room applications because it can be easily transported and installed. Full vacuum FTIR systems can provide excellent quantitative analysis of carbon dioxide and water vapor in air with a high degree of accuracy. Gas cells with path lengths from 10 cm to 20 meters are available and a suitable cell can be selected depending upon the required gas concentrations.
Experimental
Measurement Example 1
Figure 2 shows the standard spectra of several perfluorocarbon compounds (PFC), identified as greenhouse gases. The absorption peaks in the infrared spectra are observed in a very narrow wavenumber range due to their similar chemical structures. Of particular interest is perfluoromethane, with an absorption peak at 1280 cm-1, which overlaps with an absorption peak of perfluoropentane. In cases like these, it is difficult to set a single quantitative peak for reliable analysis. For example, when the 5 different gases outlined in Figure 2 are quantified, the accuracy in quantitation can be improved by estimating each gas concentration in order from No. 1 to No. 5 as shown in the figure and subtracting a calculated spectrum for each component based on the estimated concentration in series from the measured spectra. A single peak can be set by the quantitative analysis program at a specific position (highlighted by an arrow in the figure), according to the number. This allows the quantitative analysis of the perfluoromethane concentration. Multivariate analysis makes it possible to perform quantitative analysis even where there is no single analyte peak. However, this may not be practical as it is necessary to prepare many standard concentrations of mixtures and the quantitative accuracy may suffer at low concentrations. By contrast, the spectra of hydrofluorocarbons (HFC) have more analyte peaks than those of PFC compounds. Therefore, a continuous measurement program for multiple components using subtracted spectra may be more effective. It should be noted that conventional methods for quantitative analysis of multiple gases can be difficult and the outlined approach may have more success in these cases.
Measurement Example 2
Figure 3 Spectra of formaldehyde, acetaldehyde, toluene and acetic acid are provided as examples of compounds that can cause ‘sick building’ syndrome or simple air pollution. The absorption peaks of formaldehyde and acetaldehyde overlap with the formaldehyde peaks obscured by the broad absorption band of acetaldehyde. In this example, the concentration for acetic acid (No. 1) is estimated using the peak at 1290 cm-1. After subtracting the amount of acetic acid, acetaldehyde (No. 2) is calculated using the 1110 cm-1 peak. Finally, the ‘hidden’ peak of formaldehyde is determined using the peak at 1745 cm-1. For these complicated quantitative determinations, if the order of the components is evaluated and set in advance, all components can be calculated automatically and simultaneously, and using a ‘Time Course Measurement’ program it possible to perform continuous monitoring with resulting calculated concentrations.
Keywords
230-TR-0201, air pollution, gas analysis, FTIR, formaldehyde, HC0H, acetaldehyde, perflurorocarbon, perfluoromethane, perfluoropentane, PFC, sick building syndrome, time course FTIR measurement