Analysis of Electronic Structure of Phthalocyanine Complex Using Magnetic Circularly Polarized Luminescence (MCPL) Spectroscopy
December 4, 2025 Download This Application
Introduction
Phthalocyanine complexes with MCPL properties have attracted attention for their potential applications in 3D displays, security inks, and circularly polarized organic light emitting diodes (CP-OLEDs).1) In the research and development of these photophysical materials, it is important to obtain a detailed understanding of their electronic structure and their optical and magnetic properties during the emission process. MCPL spectroscopy has been utilized to obtain such information for phthalocyanines and porphyrins, which exhibit characteristic photophysical properties.2-4)
MCPL measurements are performed by applying a magnetic field to a sample in a Faraday configuration in which the directions of the magnetic field and light propagation are parallel to each other and detecting the difference in luminescence intensity for left-handed circularly polarized (lcp) and right-handed circularly polarized (rcp) light. This is achieved using a CPL measurement system with a 180-degree optical configuration as shown in Figure 1. The electronic structure and optical and magnetic properties of the molecules during the emission process can then be evaluated by analyzing the obtained MCPL and luminescence spectra. While CPL is a general characteristic of molecules with chiral structures, MCPL results from different interactions of lcp and rcp light with the electronic states of molecules under an external magnetic field. Thus, MCPL can be obtained from all molecules that exhibit luminescence properties, regardless of the presence of chirality.
This report describes MCPL and fluorescence spectroscopy measurements of phthalocyanine chloroaluminum (AlPc) using the JASCO CPL-300 with a 180-degree optical configuration. The obtained spectra were analyzed using time-dependent density functional theory (TD-DFT) to assign fluorescence bands in the emission process. In addition, using a direct-separation approach to identify the fluorescence components associated with lcp and rcp light,5) the distributions of the two electronic states in the emission process were determined and compared with the Boltzmann distribution.

Experimental
Sample
5.8×10⁻⁷ mol/L AlPc in tetrahydrofuran (THF) solution
System
Instrument: CPL-300 CPL spectrometer
Accessory: PMCD-586 Compact permanent magnet
Software: Spectra measurement program
Parameters
| Ex. Wavelength: | 365 nm | Scanning Speed: | 50 nm/min |
| Ex. Slit Width: | 4000 mm | Em. Bandwidth: | 16 nm |
| Response (D.I.T): | 8 sec | Data Interval: | 0.1 nm |
| Accumulations: | 9 | Path Length: | 5 mm |
Keywords
Magnetic circularly polarized luminescence, MCPL, Circularly polarized luminescence, CPL, Time-dependent density functional theory, TD-DFT, Phthalocyanine, Porphyrin
Results
Assignment of MCPL bands based on TD-DFT calculations
MCPL and fluorescence spectra of an AlPc solution are shown in Figure 2. The fluorescence bands for phthalocyanine complexes have an extremely small Stokes shift in this wavenumber region, resulting in self-absorption of fluorescence by the sample itself. Therefore, spectra following correction for self-absorption are shown here.6) The fluorescence spectrum exhibits a strong band with a peak wavenumber of 14870 cm-1. In the MCPL spectrum, a strong negative band with a peak wavenumber of 14810 cm-1 and a weak positive band with a peak wavenumber of 15200 cm-1 are observed.
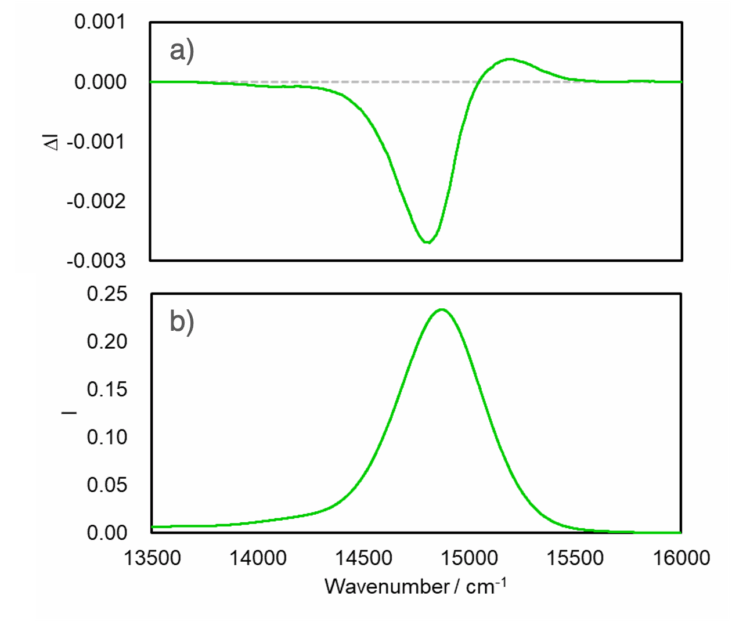
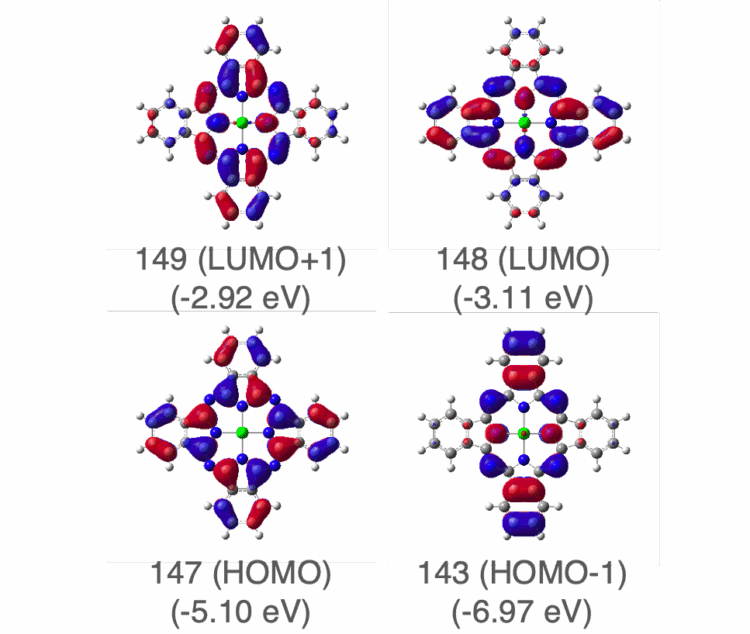
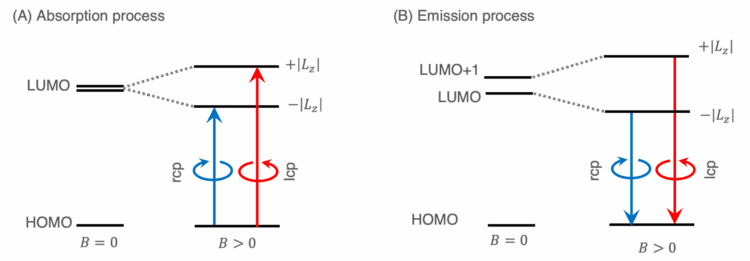
Figure 3 shows the energy levels and Kohn-Sham orbitals corresponding to the observed fluorescence bands obtained from TD-DFT calculations at the B3LYP/6-31G(d) level. The corresponding transition energies are listed in Table 1. It is considered that the absorption process involves an electronic transition from the HOMO to the doubly degenerate LUMO (Figure 4(A), left).5) In contrast, during the emission process, the degeneracy of the LUMO is lifted, yielding two separate emission states (HOMO)1(LUMO)1 and (HOMO)1(LUMO+1)1.
This lifting of the degeneracy is due to a Jahn-Teller distortion induced by the presence of a single electron in the doubly degenerate LUMO. Applying a magnetic field (𝐵) to a molecule with such an electronic state causes Zeeman splitting with mixing of the two states, leading to an increased energy difference between them (Figure 4(B)). Thus, it is considered that the strong negative band at lower wavenumber in the MCPL spectrum is due to emission from the -|Lz |state, and the weak positive band at higher wavenumber is due to emission from the +|Lz | state.
Table 1. Excitation energy, oscillator strength f, and transitions in emission processes| Excited State | Excitation Energy / eV (Oscillator Strength) | Transitions (% Weight) |
|---|---|---|
| 1 | 1.9409 (0.3978) | 143 → 149 (3) 147 → 148 (96) |
| 2 | 2.0486 (0.3533 | 143 → 148 (6) 147 → 149 (94 |
Distribution of electronic states in emission process based on direct-separation approach
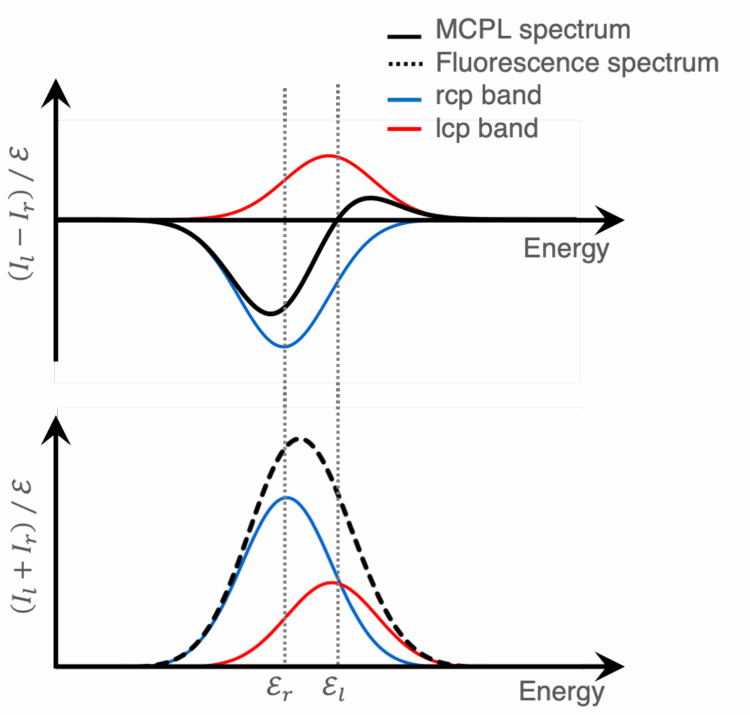
As described above, the MCPL and fluorescence spectra of AlPc contain fluorescence bands derived from lower-energy rcp light and higher-energy lcp light. These bands can be expressed using the normalized band shape (fl(E) and fr(E)), central wavenumber (El and Er), and dipole strength (Dl and Dr), and the relationship between these parameters and ΔI or I can be described as follows (Figure 5).5)
(A) MCPL and (B) fluorescence spectra
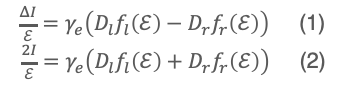
Here, γe is a constant. γeDl and γeDr can be determined by optimizing each parameter so that the shape
of the calculated spectra based on equations (1) and (2) matches the measured spectra. By calculating these ratios, the ratio of the distribution of the two electronic states in the emission process can be
calculated.
![]()
The Boltzmann distribution is expressed as
![]()
where Nl and Nr are the number of electrons in each energy state, k is Boltzmann’s constant and T is temperature.
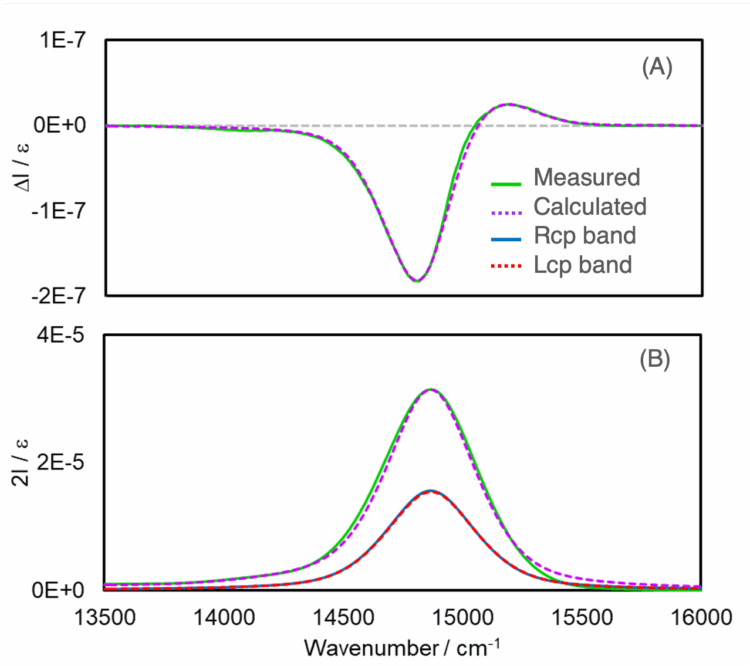
Figure 6 shows spectra calculated using the direct-separation approach, as well as measured spectra. Note that in Figure 6(A), the band intensities for rcp and lcp exceed the vertical axis range, so the calculation results for these bands are not shown. The analysis shows good agreement between the measured and calculated spectra. The Dl ∕ Dr and Nl ∕ Nr values obtained through this analysis are 0.9937 and 0.9935, respectively, which are very similar. This suggests that the emission state in the relaxation process follows a Boltzmann distribution.
Conclusion
MCPL and fluorescence spectra of AlPc were obtained using the JASCO CPL-300. Assignment of the MCPL bands in the emission process was then performed by comparing the measured spectra with the calculation results based on TD-DFT. In addition, the distribution of the two electronic states and the Boltzmann distribution during the emission process were compared using the direct-separation approach. It was found that the Boltzmann distribution well describes the emission state for AlPc. These results indicate that MCPL spectroscopy is remarkably effective for evaluating the electronic structure and optical properties of fluorescent molecules.
References
1)S. Suzuki, D. Suzuki, S. Suzuki, R. Shikura, Y. Yamamoto, S. Yagi, Y. Imai: Chem. Lett., 53, upae063 (2024). DOI: 10.1093/chemle/upae063
2)D. H. Metcalf, T. C. VanCott, S. W. Snyder, P. N. Schatz, B. E. Williamson: J. Phys. Chem., 94, 2828-2832 (1990). DOI: 10.1021/j100370a020
3)C. V. Diaconu, E. R. Batista, R. L. Martin, D. L. Smith, B. K. Crone, S. A. Crooker, D. L. Smith’s: J. Appl. Phys., 109, 073513 (2011). DOI: 10.1063/1.3569584
4)S. Ghidinelli, S. Abbate, G. Mazzeo, L. Paoloni, E. Viola, C. Ercolani, M. P. Donzello, G. Longhi: Chirality, 32, 808-816 (2020). DOI: 10.1002/chir.23221
5)S. Suzuki, A. Santria, T. Oyama, K. Akao, N. Ishikawa: Chirality, 36, e23625 (2024). DOI: 10.1002/chir.23625
6)E. Castiglioni, S. Abbate, F. Lebon, G. Longhi: Chirality, 24, 725-773 (2012) DOI: 10.1002/chir.22023
This work was performed under the guidance of Professor Naoto Ishikawa, Department of Chemistry, Graduate School of Science, Osaka University.
Related Application Note
a)180-CD-0047 Analysis of Electronic Structure and Orbital Angular Momentum of Zinc Phthalocyanine using MCD Spectroscopy
b)180-CD-0048 Efficient Evaluation of Substituent Effects in Phthalocyanines using Automated CD Measurements