Analysis of Carbon Products using Raman Spectroscopy
April 8, 2025Introduction

Carbon exhibits a variety of characteristics through its diverse structures, ranging from hard diamonds used in cutting tools and jewelry to soft graphite used in pencil lead and other materials. When analyzing carbon materials, although an elemental analysis can identify the presence of carbon, it cannot provide information about the structure. X-ray diffraction analysis can be used to obtain information about the crystal structure, but analysis of local regions or amorphous material is difficult.1) Raman spectroscopy, on the other hand, can identify the presence of carbon and also obtain structural information (Figure 1), and has the advantage of being a non-destructive, non-contact measurement method applicable to submicron regions.
This report describes the results of imaging measurements performed using a JASCO Raman microscope for three types of mechanical pencil refills (hereafter referred to as “refills”) with different hardness values.
Experimental
Sample
Refills from the same manufacturer and series: 3 types (2B, HB, H)
The refills were secured with a JASCO micro vice holder so that the cross section of the refill was the measurement surface.

System
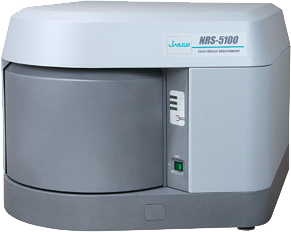
Instrument: NRS-5500 Raman spectrometer
Parameters
Laser wavelength: 532 nm
Objective lens: 20x
Laser power: 3.2 mW at sample surface
Exposure time: 1 sec
Accumulations: 1
Measurement interval: 5 µm
Data points: 115×115 (about 0.5-mm square)
Keywords
Carbon, graphite, mechanical pencil lead, crystal structure, Raman spectroscopy, histogram
Results

Raman spectra with peaks assigned to carbon were obtained by imaging measurements over the entire sample area for the three refills (Figure 3). In the spectra of carbon samples, a D-band at around 1350 cm-1, associated with crystal disorder, and a G-band at around 1580 cm-1, originating from the graphite structure (sp2 carbon), are generally observed. Here, the ratio of the intensity of the G-band to the D-band (GD ratio) was used to produce a chemical image of the sample surface, and the results obtained were subjected to a histogram analysis.
From the chemical images and histograms obtained, it was found that the softer (darker) the refill, the higher the GD ratio. Since the refills are manufactured by blending graphite and additives and then solidifying the mixture at high temperature,2) it is likely that GD ratio reflects differences in the manufacturing process.
Conclusion
Raman spectroscopy can be used to identify carbon regions with different structures and to evaluate the degree of crystallinity based on the G-band to D-band intensity ratio. In combination with imaging measurements, it can also be used to obtain micrometer-scale surface information about a sample, and the histogram calculation function allows a statistical understanding of the results. Raman spectroscopy is therefore effective for evaluating the material properties of carbon in localized regions, which is difficult with other analytical methods, and it is therefore an essential tool for carbon analysis.
References
1) K. Fujisawa: Research reports from the Nagano Prefectural General Industrial Technology Center, No. 9, p. M33-M35 (2014)
2) Japan Writing Instruments Manufacturers Association: <http://www.jwima.org/sharp-pencil/00-1sharp-pencil/00-1sharp-pencil.html>, (accessed 2024.3.19)
Applicative Solution Lab Division E. Taira

Analysis of Carbon Products using Raman Spectroscopy
Introduction

Carbon exhibits a variety of characteristics through its diverse structures, ranging from hard diamonds used in cutting tools and jewelry to soft graphite used in pencil lead and other materials. When analyzing carbon materials, although an elemental analysis can identify the presence of carbon, it cannot provide information about the structure. X-ray diffraction analysis can be used to obtain information about the crystal structure, but analysis of local regions or amorphous material is difficult.1) Raman spectroscopy, on the other hand, can identify the presence of carbon and also obtain structural information (Figure 1), and has the advantage of being a non-destructive, non-contact measurement method applicable to submicron regions.
This report describes the results of imaging measurements performed using a JASCO Raman microscope for three types of mechanical pencil refills (hereafter referred to as “refills”) with different hardness values.
Experimental
Sample
Refills from the same manufacturer and series: 3 types (2B, HB, H)
The refills were secured with a JASCO micro vice holder so that the cross section of the refill was the measurement surface.

System
Instrument: NRS-5500 Raman spectrometer
Parameters
Laser wavelength: 532 nm
Objective lens: 20x
Laser power: 3.2 mW at sample surface
Exposure time: 1 sec
Accumulations: 1
Measurement interval: 5 µm
Data points: 115×115 (about 0.5-mm square)
Results

Raman spectra with peaks assigned to carbon were obtained by imaging measurements over the entire sample area for the three refills (Figure 3). In the spectra of carbon samples, a D-band at around 1350 cm-1, associated with crystal disorder, and a G-band at around 1580 cm-1, originating from the graphite structure (sp2 carbon), are generally observed. Here, the ratio of the intensity of the G-band to the D-band (GD ratio) was used to produce a chemical image of the sample surface, and the results obtained were subjected to a histogram analysis.
From the chemical images and histograms obtained, it was found that the softer (darker) the refill, the higher the GD ratio. Since the refills are manufactured by blending graphite and additives and then solidifying the mixture at high temperature,2) it is likely that GD ratio reflects differences in the manufacturing process.
Conclusion
Raman spectroscopy can be used to identify carbon regions with different structures and to evaluate the degree of crystallinity based on the G-band to D-band intensity ratio. In combination with imaging measurements, it can also be used to obtain micrometer-scale surface information about a sample, and the histogram calculation function allows a statistical understanding of the results. Raman spectroscopy is therefore effective for evaluating the material properties of carbon in localized regions, which is difficult with other analytical methods, and it is therefore an essential tool for carbon analysis.
Keywords
Carbon, graphite, mechanical pencil lead, crystal structure, Raman spectroscopy, histogram
References
1) K. Fujisawa: Research reports from the Nagano Prefectural General Industrial Technology Center, No. 9, p. M33-M35 (2014)
2) Japan Writing Instruments Manufacturers Association: <http://www.jwima.org/sharp-pencil/00-1sharp-pencil/00-1sharp-pencil.html>, (accessed 2024.3.19)
Applicative Solution Lab Division E. Taira

 Download This Application