Combined SFC-MS System Analysis of Cannabinoid Potency and Terpene Analysis
July 28, 2025
 Download This Application
Introduction
As countries and states in the U.S. continue to legalize medicinal and recreational marijuana use, there is a need for a simple and reliable analysis method to determine the cannabinoid levels for growers and testing labs. This method would not only allow potency determination for quality control, but also provide growers important information to monitor their process and product. For testing labs, short analysis times are imperative as the sample quantities are sure to increase as the market grows.
Currently terpene analysis is performed by gas chromatography requiring a second instrument increasing the lab operation cost. Here we show how this can be overcome by also performing the terpene analysis on the SFC showing the versatility of one instrument doing the job of two. With the addition of a mass spectrometer, identity confirmation of the cannabinoids and terpenes can be achieved.
Preparative SFC is often the preferred technique for preparative purifications for its short analysis times, low solvent consumption and easy fraction recovery. The use of a semi-prep SFC-MS in this application provides analytical analysis of cannabinoids and terpenes with identification using Mass Spec. and the direct scale-up to purification of the cannabinoids using Mass directed fraction collection.
Experimental
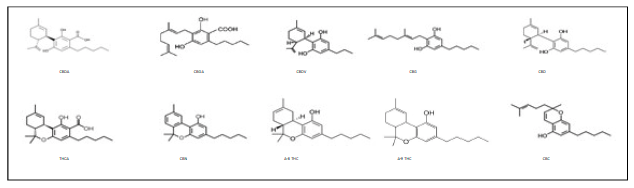
The cannabinoid standard consisting of the cannabinoids shown in figure 1 was obtained from Cayman Chemicals. The terpenes sample containing 19 terpenes was obtained from Restek. The columns used were Lux Cellulose-2 (5um 4.6 x 250mm), IB N-5 (5um, 4.6 x 250mm) and Finepak SIL C18 (5um, 4.6 x 150mm) for the separations using a Carbon Dioxide and Ethanol. The JASCO SFC-4000 with Advion CMS L Mass Spectrometer was used for the analysis.
Keywords
SFC 2018, SFC, SFC-MS, Mass Spectrometer
Results
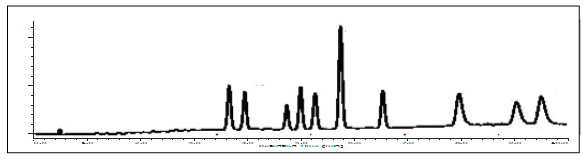
The 10 cannabinoids are separated and identified in less than 10 minutes as shown in figure 2. This has been established and scaled up for preparative purification for individual cannabinoid standards or for modifications to the mixture for different applications.
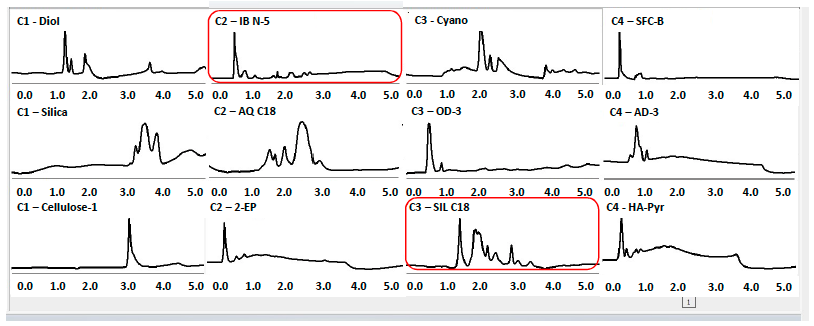
For terpenes, the results of the parallel 4 column screening of 12 columns is shown below in Figure 3. A variety of columns were used with the names listed above each chromatogram. Most columns showed little retention/separation with the exception of the two columns IB N-5 and SIL C18.
The chromatograms of the separation of the terpene standard on the IB N-5 and SIL C18 columns are shown below in figure 4. The IB N-5 does not separate the early eluting terpenes, but does separate the later eluting. The SIL C18 column provides the opposite with better retention of the early eluting, but less retention of the later eluting terpenes.
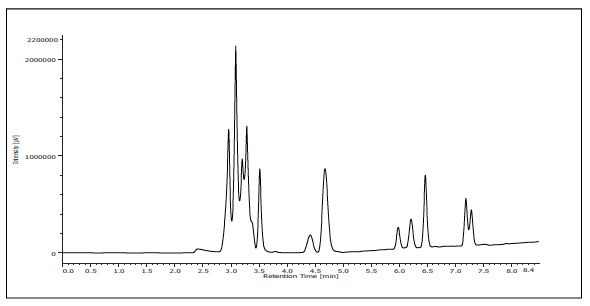
With the ability to pair columns on-line in SFC to either increase effective column length or to change the retention behavior, a combination of the 2 columns was used. Two SIL C18 (5um, 4.6 x 150mm) and one IB N-5 (5um, 4.6 x 250mm) we combined. The resulting the chromatogram is shown below in figure 5 and provides the advantage of each column into one separation. Both the early and late eluting terpenes are better resolved allowing for identification of 17 of the 19 terpenes via UV using various wavelengths.
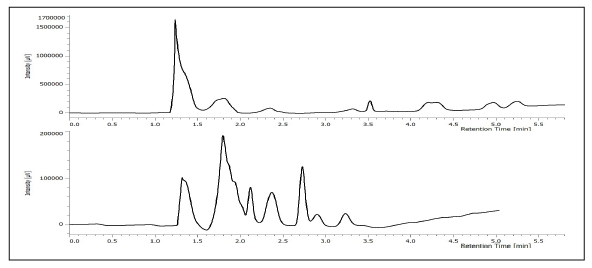
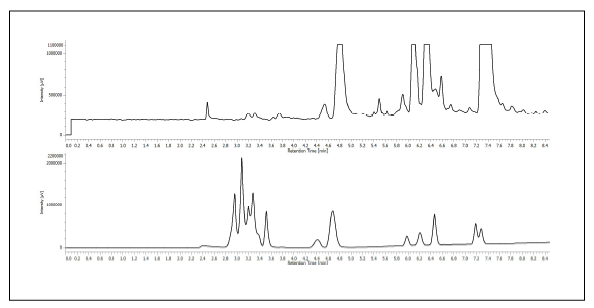
The mass spectrometer TIC is shown below and stacked above the 210nm chromatogram showing the coinciding signal from each for the terpenes. Additional terpenes that were not seen on the UV appear on the mass spec. TIC between minutes 5 and 6.
Conclusion
The successfully separation of terpenes on SFC widens the application of SFC to the cannabis industry. This terpene analysis adds to the ability for SFC to rapidly separate and determine the potency of the cannabinoids and purify those individual cannabinoids. The semi-prep SFC provides rapid parallel analytical column screening, scale-up to purifications and powerful identification or fraction triggering when combined with the mass spectrometer.
Featured Products:
-
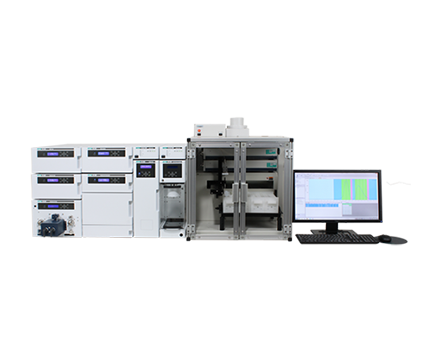
SFC-4000 Hybrid SFC for analytical and semi-preparative SFC.
Hybrid SFC System
-
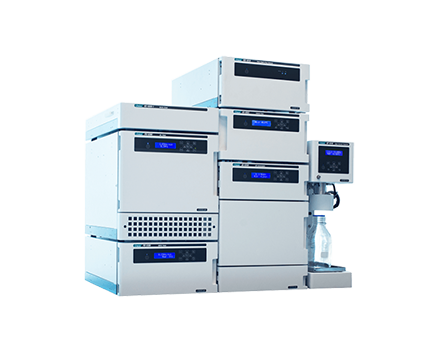
SFC-4000 Analytical SFC for routine separation to method development.
Analytical SFC System

Combined SFC-MS System Analysis of Cannabinoid Potency and Terpene Analysis
Introduction
As countries and states in the U.S. continue to legalize medicinal and recreational marijuana use, there is a need for a simple and reliable analysis method to determine the cannabinoid levels for growers and testing labs. This method would not only allow potency determination for quality control, but also provide growers important information to monitor their process and product. For testing labs, short analysis times are imperative as the sample quantities are sure to increase as the market grows.
Currently terpene analysis is performed by gas chromatography requiring a second instrument increasing the lab operation cost. Here we show how this can be overcome by also performing the terpene analysis on the SFC showing the versatility of one instrument doing the job of two. With the addition of a mass spectrometer, identity confirmation of the cannabinoids and terpenes can be achieved.
Preparative SFC is often the preferred technique for preparative purifications for its short analysis times, low solvent consumption and easy fraction recovery. The use of a semi-prep SFC-MS in this application provides analytical analysis of cannabinoids and terpenes with identification using Mass Spec. and the direct scale-up to purification of the cannabinoids using Mass directed fraction collection.
Experimental
The cannabinoid standard consisting of the cannabinoids shown in figure 1 was obtained from Cayman Chemicals. The terpenes sample containing 19 terpenes was obtained from Restek. The columns used were Lux Cellulose-2 (5um 4.6 x 250mm), IB N-5 (5um, 4.6 x 250mm) and Finepak SIL C18 (5um, 4.6 x 150mm) for the separations using a Carbon Dioxide and Ethanol. The JASCO SFC-4000 with Advion CMS L Mass Spectrometer was used for the analysis.
Results
The 10 cannabinoids are separated and identified in less than 10 minutes as shown in figure 2. This has been established and scaled up for preparative purification for individual cannabinoid standards or for modifications to the mixture for different applications.
For terpenes, the results of the parallel 4 column screening of 12 columns is shown below in Figure 3. A variety of columns were used with the names listed above each chromatogram. Most columns showed little retention/separation with the exception of the two columns IB N-5 and SIL C18.
The chromatograms of the separation of the terpene standard on the IB N-5 and SIL C18 columns are shown below in figure 4. The IB N-5 does not separate the early eluting terpenes, but does separate the later eluting. The SIL C18 column provides the opposite with better retention of the early eluting, but less retention of the later eluting terpenes.
With the ability to pair columns on-line in SFC to either increase effective column length or to change the retention behavior, a combination of the 2 columns was used. Two SIL C18 (5um, 4.6 x 150mm) and one IB N-5 (5um, 4.6 x 250mm) we combined. The resulting the chromatogram is shown below in figure 5 and provides the advantage of each column into one separation. Both the early and late eluting terpenes are better resolved allowing for identification of 17 of the 19 terpenes via UV using various wavelengths.
The mass spectrometer TIC is shown below and stacked above the 210nm chromatogram showing the coinciding signal from each for the terpenes. Additional terpenes that were not seen on the UV appear on the mass spec. TIC between minutes 5 and 6.
Conclusion
The successfully separation of terpenes on SFC widens the application of SFC to the cannabis industry. This terpene analysis adds to the ability for SFC to rapidly separate and determine the potency of the cannabinoids and purify those individual cannabinoids. The semi-prep SFC provides rapid parallel analytical column screening, scale-up to purifications and powerful identification or fraction triggering when combined with the mass spectrometer.
Keywords
SFC 2018, SFC, SFC-MS, Mass Spectrometer