Determination of Absolute Configuration of Molecules using VCD Spectrometer and DFT Calculations
December 3, 2025 Download This Application
Introduction
Determining the absolute configuration of chiral molecules is essential in various fields, including drug development, elucidation of biological mechanisms, and synthesis of novel substances. Although X-ray diffraction (XRD) is often employed as the most reliable method, the process of preparing a single crystal of the target molecule is time-consuming, and the method is difficult to apply to molecules that are challenging to crystallize. Nuclear magnetic resonance (NMR) spectroscopy is also effective for absolute configuration determination, but it requires sample processing steps such as derivatization or the addition of chiral shift reagents.
A simpler method for determining the absolute configuration is the combination of vibrational circular dichroism (VCD) spectroscopy and computational chemistry, particularly for small molecules, since it does not require crystallization or derivatization procedures. This report describes an example of determining the absolute configuration of santonin, which is a natural medicine historically taken to expel roundworms, by comparing the VCD spectrum measured using the JASCO FVS-6000 VCD spectrometer with theoretical spectra calculated using density functional theory (DFT).
Experimental
Sample
120-mg/mL santonin solution
Solvents
- Deuterated chloroform (CDCl3) (1650 to 940 cm-1)
- Chloroform (CHCl3) (940 to 850 cm-1)*
*Chloroform was used as a solvent for measurements at wave numbers below 940 cm-1 because deuterated chloroform exhibits strong absorption in this region, which prevents acquisition of the VCD spectrum of santonin.
System
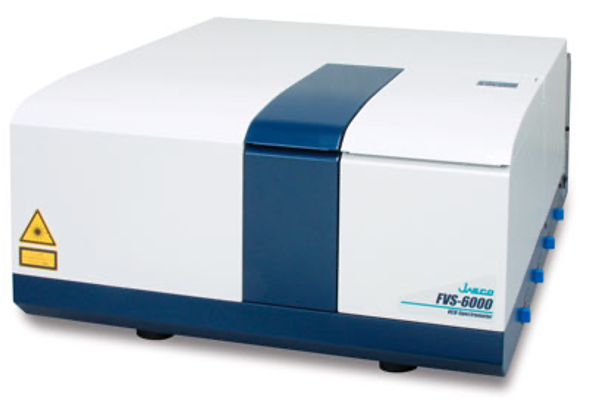
Instrument: FVS-6000 Vibrational Circular Dichroism Spectrometer
Parameters
Wavelength range: 1650 to 850 cm-1
Resolution: 4 cm-1
Accumulations: 3000 (approximately 30 mins)
Cell path length: 0.05 mm
Cell: Fixed BaF2 liquid cell
DFT Calculation Method
Spectral calculations were performed using the procedure described below with the Gaussian 16 Rev. C. 01 program.
DFT Calculation Procedure
- Initial molecular structures for calculation
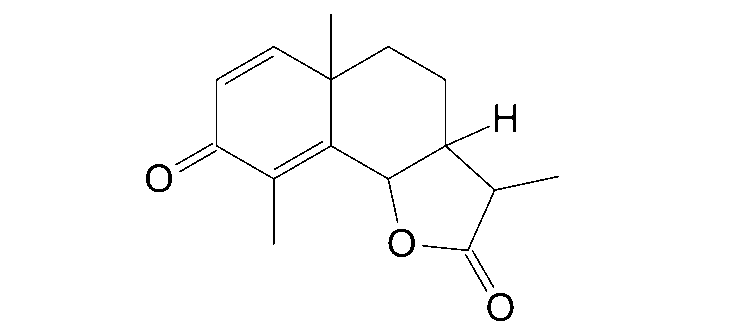
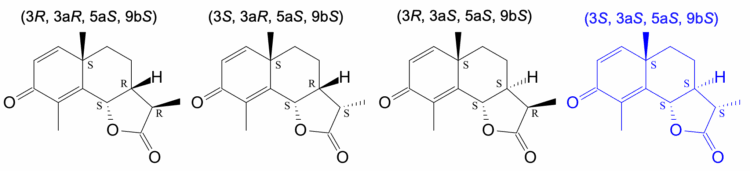
Based on the planar chemical structure of santonin (Figure 1), the four expected stereoisomers shown in Figure 3 were input and calculations were performed.
2. Calculation parameters
The calculations were performed using the following parameters:
Calculation method: B3LYP / 6-311+G (d, p)
Calculation type: Opt (geometry optimization), Freq = VCD (vibrational frequency and VCD calculation)
*Different terminology may be used for the calculation type in other quantum chemistry calculation software, such as Jaguar.
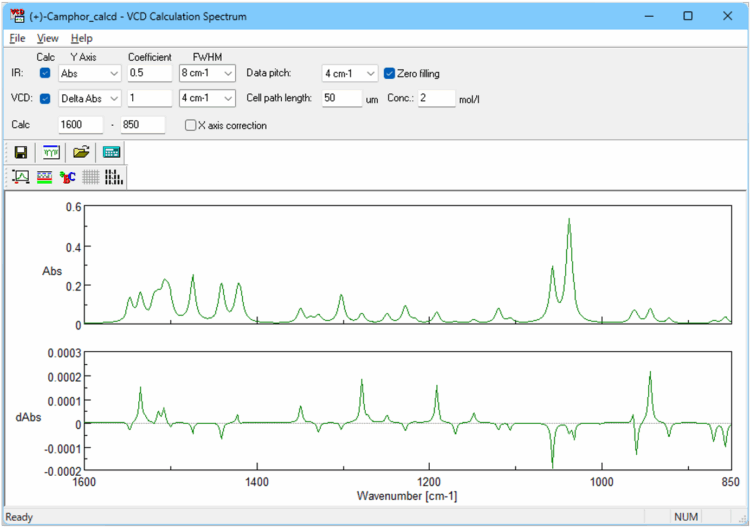
3. Output of theoretical spectra to analysis program
The results obtained using Gaussian or Jaguar calculations (output files: .log or .out) can be read by the [VCD Calculation Spectrum] program (Figure 4) bundled with the FVS-6000. This allows the results to be displayed as a spectrum, where the resolution, concentration, and optical path length can be adjusted for comparison with the experimental spectrum. The calculated spectrum can also be transferred to the separate [Spectrum Analysis] program for data processing, such as arithmetic operations.
Keywords
Absolute configuration, Vibrational circular dichroism, VCD, Computational chemistry, DFT, Chiral molecule, FVS-6000, Natural medicine
Results
Figure 5 shows the experimental spectrum of santonin measured by the FVS-6000, together with the theoretical spectra of the santonin stereoisomers obtained by DFT calculations. Typically, the experimental spectrum is influenced by environmental factors such as the temperature and solvent, while the calculated spectrum is based on approximations. Consequently, slight wavenumber shifts and discrepancies in peak signs and intensities usually arise between the two.
In this study, we assigned absorption peaks in the IR spectrum (Fig. 5) that had similar intensity ratios relative to their surrounding peaks as corresponding peaks. By comparing the VCD signals associated with these absorption bands, the structure showing the closest agreement was determined as the absolute configuration.
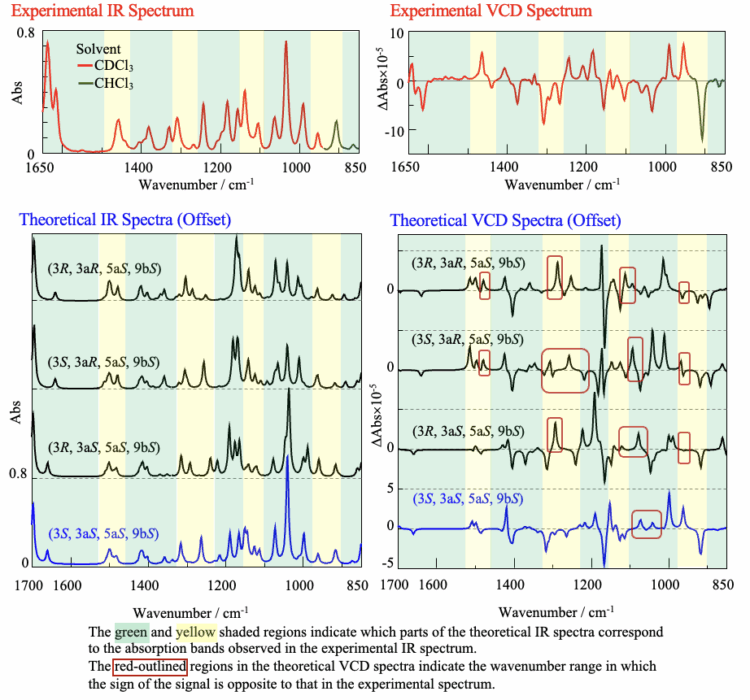
Although all the theoretical IR spectra exhibit a similar shape, the theoretical VCD spectra are found to differ regarding the signal sign (polarity) and intensity ratio. The signal at 1040 cm-1 was calculated to originate from C-O-C stretching vibrations. Since this structure is highly susceptible to hydrogen-bonding interactions with the deuterium atoms in the deuterated chloroform solvent, it is most likely that this led to the discrepancies between the experimental and theoretical VCD spectra in this region.
Based on this analysis, it can be concluded that the structure (3S, 3aS, 5aS, 9bS), which yields the theoretical spectrum (blue line in Fig. 5) that best matches the experimental spectrum outside of the 1040 cm-1 region, represents the absolute configuration of santonin. This result is consistent with the absolute configuration of santonin reported in the literature1).
Conclusion
We successfully determined the absolute configuration of the natural compound santonin by comparing the VCD spectrum measured using the FVS-6000 with the theoretical spectra of stereoisomers predicted by DFT calculations. VCD spectroscopy offers the advantage of allowing analysis of chiral molecules without laborious crystallization or derivatization processes. Combined with computational chemistry, it is a simple and effective method for determining the absolute configuration of chiral molecules. This determination process is conveniently performed using the software bundled with the FVS-6000.
References
Y. Abe. J. Synth. Org. Chem. Jpn., 13, 575 (1955). DOI: 10.5059/yukigoseikyokaishi.13.575
Trademark Notices
Gaussian is a registered trademark of Gaussian, Inc.
Jaguar is a registered trademark of Schrödinger, Inc.