Evaluation of Degradation of POM by Molecular Weight Distribution Measurements
April 20, 2026 Download This Application
Introduction
Polyacetal, commonly known as polyoxymethylene (POM) or acetal, is a widely utilized engineering polymer used in mechanical components and various industrial applications due to its excellent mechanical strength and chemical resistance. However, POM is susceptible to degradation induced by environmental factors, such as ultraviolet (UV) light exposure and repeated recycling. Quantitative evaluation of the resulting changes in physical properties is therefore essential for both product development and quality control.
Gel permeation chromatography (GPC) is a standard analytical technique for characterizing polymers by determining their molecular weight distribution. In the analysis of POM, hexafluoroisopropanol (HFIP) is commonly used as the mobile phase due to its excellent solvation properties; however, the high cost of HFIP presents a significant limitation when large solvent volumes are required. Semi-micro scale GPC offers an effective approach to reduce solvent consumption while simultaneously enabling faster analysis.
In this application note, the photodegradation behavior of POM was investigated using samples subjected to xenon-arc accelerated weathering. Molecular weight distributions were determined using a semi-micro scale GPC system compatible with HFIP, equipped with a refraction index detector (RI-4035) and a high-performance analytical GPC column. Data analysis was performed using the molecular weight distribution calculation program in ChromNAV. A molecular weight calibration curve was generated using polymethyl methacrylate (PMMA) standards, and the molecular weight distribution of the POM samples was subsequently calculated.
Experimental
Instruments
Pump: PU-4185
Autosampler: AS-4150*
Column oven: CO-4060
RI detector: RI-4035
*with option units
LC Conditions
Column: PC LF-404 (4.6 mm I.D. x 250 mm L, 6 µm)
Eluent: 5 mmol/L sodium trifluoroacetate in HFIP
Flow rate: 0.15 mL/min
Column temp: 40 ºC
Injection volume: 20 µL
Sample
Standard samples for creating molecular weight calibration curve
Standard samples for creating molecular weight calibration curve
Polymethyl methacrylate (PMMA) mixed sample
(two samples prepared for different molecular weight peaks (Mp)
Standard sample 1: Mp 772,000; 51,900; 6,900; 645
Standard sample 2: Mp 211,000; 21,700; 2,200
Each sample was dissolved and diluted in the mobile phase to 0.025 % (w/v)
Test Samples for Evaluation
POM test samples (approximately 3 mm, pellet-shaped, Standard Test Piece Co., Ltd.)
Keywords
POM, gel permeation chromatography, GPC, molecular weight distribution, polymethyl methacrylate, PMMA, molecular weight calibration curve, hexafluoroisopropanol, HFIP, semi-micro scale, refractive index detector, RI detector
Results
Figure 2 illustrates the procedure used for the photodegradation test. Light irradiation was performed using a xenon accelerated weathering tester (SOLARBOX 1500e, manufactured by Cofomegra and provided by JASCO INTERNATIONAL Co., Ltd.) at an irradiance of 60 W/m² and a temperature of 65 ºC. Three POM test samples were introduced at staggered intervals to achieve total irradiation times of 10 days, 5 days, and 1 day (Samples 1, 2, and 3, respectively).
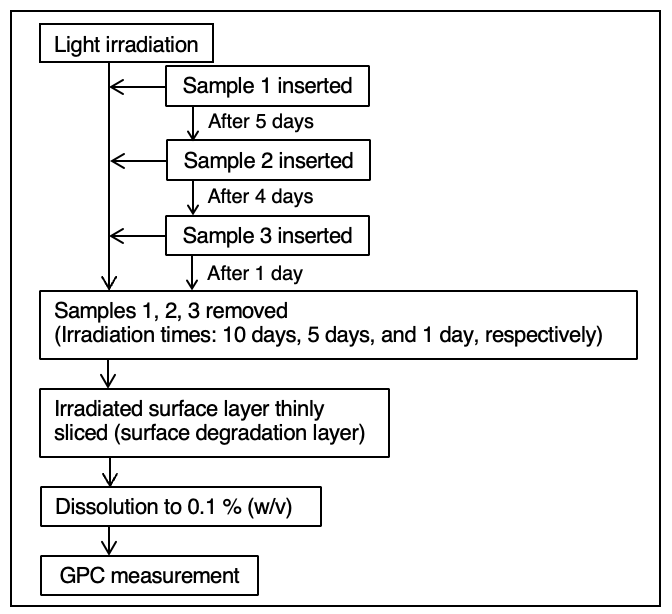
Following irradiation, the degraded surface of each sample was removed using a plane-type slicer (Slice Master KS-10, provided by JASCO Engineering Co., Ltd.). The collected material were dissolved in the mobile phase at a concentration of 0.1% (w/v) and analyzed by GPC.
Figure 3 shows chromatograms obtained for two PMMA standard samples, and Figure 4 shows the corresponding calibration curve.
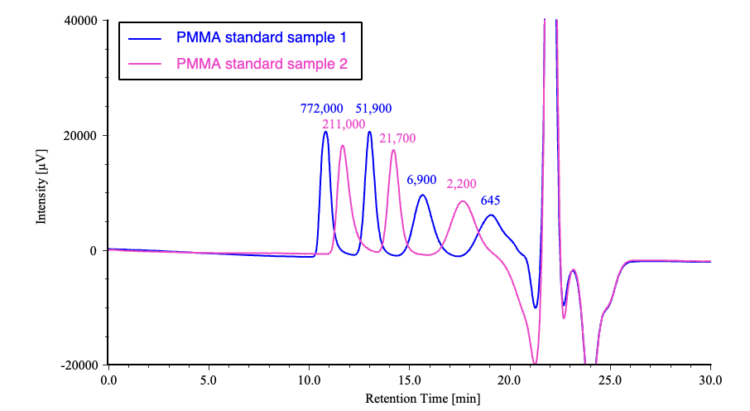
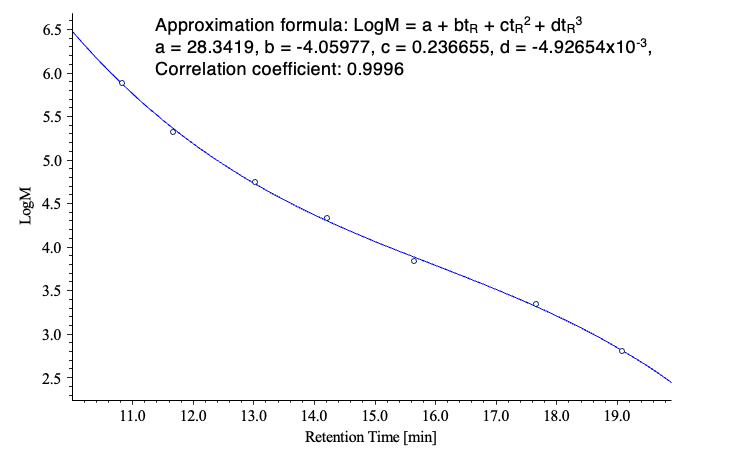
Figure 5 compares chromatograms of the irradiated POM samples with that of an unirradiated control sample. The corresponding differential molecular weight distribution curves are shown in Figure 6, where the horizontal axis represents the logarithm of the molecular weight to facilitate visualization of distribution changes. The results clearly indicate that the molecular weight distribution shifts toward lower molecular weight with increasing irradiation time.
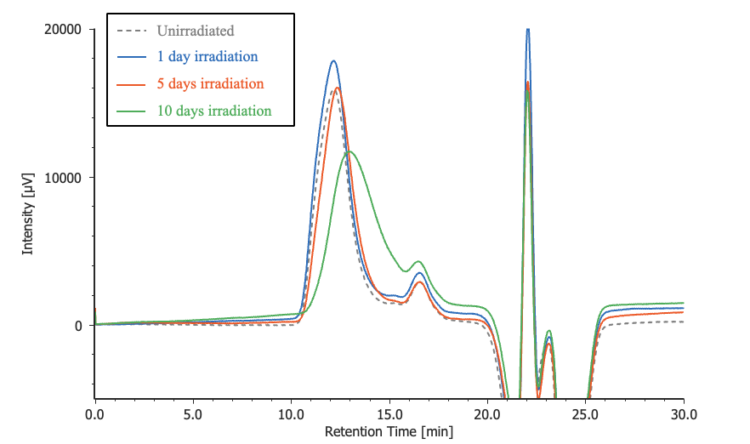
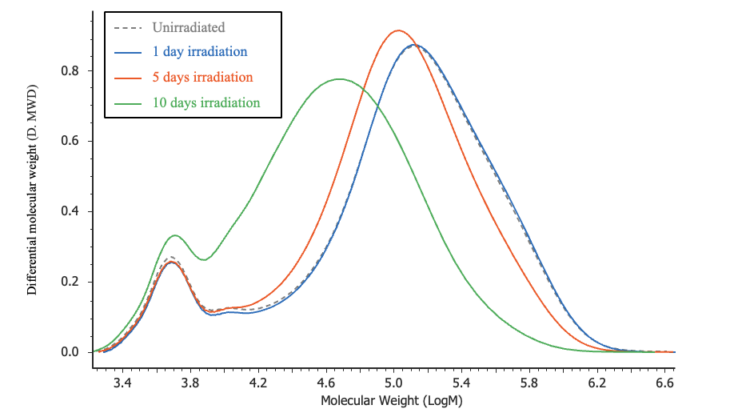
Table 1 summarizes the PMMA-equivalent average molecular weight calculation results. Figure 7 shows the variation of number-average molecular weight (Mn) and weight-average molecular weight (Mw) as a function of irradiation time. As irradiation time increases, the peak molecular weight (Mp) decreases, whereas Mn and Mw exhibit a slight initial increase followed by a decrease. These trends suggest that oxidation and cross-linking reactions occur preferentially during the early stages of light irradiation, after which main-chain degradation becomes the dominant process.¹˒²
Table 1. Differential molecular weight distribution curves for POM test samples
| Sample | Mp | Mn | Mw | Mw/Mn |
|---|---|---|---|---|
| Unirradiated | 129,062 | 28,054 | 166,486 | 5.93 |
| 1 day irradiation | 127,855 | 29,929 | 171,968 | 5.75 |
| 5 days irradiation | 100,785 | 27,130 | 132,442 | 4.88 |
| 10 days irradiation | 57,947 | 17,135 | 63,829 | 3.73 |
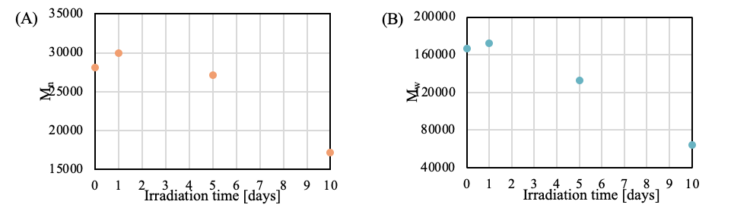
(A) : Number-average molecular weight (Mn) (B) : Weight-average molecular weight (Mw)
Conclusion
In this application note, the photodegradation of POM samples under xenon-arc irradiation was successfully evaluated using a semi-micro scale GPC system to determine the molecular weight distribution. As irradiation time increased, Mp decreased, while Mn and Mw showed a slight initial increase followed by a subsequent decrease. These results indicate that oxidation and cross-linking reactions dominate in the early stages of irradiation, followed by main-chain degradation at longer exposure times. This approach provides a reliable and efficient method for the quantitative assessment of polymer degradation, while reducing solvent consumption using semi-micro scale GPC with HFIP.
References
- V. M. Archodoulaki, S. Lüftl, T. Koch, S. Seidler: Polym. Degrad. Stab., 92, 2181 (2007).
DOI: 10.1016/j.polymdegradstab.2007.02.024
- X. Colin, J. Verdu: C. R. Chim., 9, 1380 (2006). DOI: 10.1016/j.crci.2006.06.004