Exploiting Photodiode Array Data for the Chemometric Removal of Co-Eluting Interferences in Chiral Liquid Chromatography
May 21, 2026 Download This Application
Introduction
Abstract
The analytical problem of peak overlap in chiral HPLC-UV is a persistent issue, particularly in mixtures containing multiple stereoisomers, whether in isocratic or gradient modes. This application note proposes an improved derivative spectrum chromatogram (DeSC) approach. By viewing photodiode-array (PDA) data from JASCO’s detector in the derivative space, the method exploits the spectral dimension to eliminate contributions from interfering components. To make this concept reliable, pre-smoothing, stable numerical differentiation, interpolation for accurate zero-crossing localization, edge artifact suppression, and frequency-domain denoising are incorporated. The method was evaluated on several representative systems encountered in chiral HPLC, including overlapping amino-acid enantiomers, stereoisomeric pesticide/fungicide samples, and a real tianeptine sample containing a co-eluting impurity. The results show that DeSC can recover hidden chromatographic information without iterative curve fitting, preserve relative enantiomeric ratios, and support quantitative analysis when standards are processed identically. This facile strategy provides a practical chemometric solution for complex overlap problems, although its success depends on sufficient spectral differences between the components being resolved. A link to the full code and a sample of data from JASCO HPLC-UV (PDA) are provided for readers.
M. Farooq Wahab, Siddharth Jaya Sajeevan J, Daniel W. Armstrong
Department of Chemistry and Biochemistry, University of Texas at Arlington, 76019, USA
Introduction
JASCO liquid chromatographs coupled with photodiode-array detection produce a higher-dimensional data set that captures simultaneous variation in both retention time and absorbance wavelength. One can treat this 2D data as a matrix with rows containing time information and columns containing spectral information. Chromatographers mainly use PDA data to identify the wavelengths of maximum absorption and assess peak purity by comparing spectra at different times for the suspected impure peak. In routine practice, analysts often collapse this rich information into a few single-wavelength chromatograms, without exploiting its full chemometric value [1, 2]. HPLC-PDA data can achieve much more than these simple tasks. This underuse of PDA technology becomes especially consequential when enantiomer resolution is incomplete in chiral chromatography, because the recorded signal is then a superposition of contributions from multiple co-eluting species. In such cases, conventional UV-based quantitation may obscure minor impurities, distort the apparent purity of a peak, and bias assay results. In particular, the issue becomes prominent in complex chiral mixtures, where structurally related analytes, stereoisomers, or trace contaminants elute within a narrow time window. The problem is not merely instrumental but fundamentally mathematical: the analyst is asked to infer chemically meaningful component behavior from data that are mixed simultaneously along the chromatographic and spectral axes. Since broad UV-Vis bands frequently overlap, simply selecting a different monitoring wavelength is rarely sufficient to isolate a target analyte, and more elaborate separation strategies may increase analytical cost, development time, and solvent consumption without guaranteeing complete resolution.
An interesting “digital” solution to the co-elution problem is to view PDA data in the derivative spectral domain, where the contribution of a selected component can disappear at wavelengths where its spectral derivative is zero [3, 4]. This transforms unresolved spectral overlap into a source of analytical selectivity: by extracting chromatographic traces at derivative zero-crossing wavelengths, one can reduce or remove the signal of an interfering component and thereby recover otherwise hidden information about impurities, co-eluting analytes, or overlapping enantiomeric signals. The spectrum differentiation principle is simple in theory [4, 5], but in practice, it is challenging due to noise-related issues [3, 5, 6]. It is powerful only when the numerical instabilities in spectrum differentiation and noise issues are rigorously addressed by regression [3]. Derivative operations amplify noise [5] and can be corrupted by edge artifacts and drifting baselines. Successful application of DeSC requires denoising, interpolation for accurate zero-crossing localization, baseline correction for gradient separation, and calibration procedures that subject standards and unknowns to the same mathematical transformation. In this sense, the methodology represents far more than a peak-processing “trick.” It is a principled chemometric strategy for converting underutilized detector information into selective qualitative and quantitative data, provided that overlapping species retain sufficient spectral dissimilarity within the derivative domain to be meaningfully separated. Such extracted chromatograms are called derivative spectrum chromatograms (DeSC) [3, 4].
Background
Note that everything below has been coded for easy use by anyone, and this is provided as a reference alongside a sample set [3]. Let t denote retention time, λ wavelength, and A(t, λ) the photodiode-array absorbance measured jointly over time and wavelength. Let cj (t) denote the chromatographic profile of component j, uj (λ) its pure absorption spectrum, Q the number of contributing components, and η(t,λ) the residual term, which includes detector noise. Let D(t,λ) denote the derivative spectrum chromatogram and let λ* be a wavelength at which the derivative spectrum of an undesired component vanishes. The measured PDA signal is decomposed into a bilinear form.
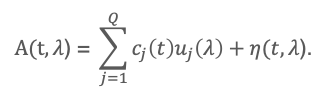
Equation (1) expresses the key advantage of PDA detection offered in JASCO HPLC detectors: the data are not a single chromatogram but a higher-order signal containing both chromatographic and spectral features. The DeSC idea is to exploit this second dimension rather than collapse the data into a single wavelength trace (as in traditional HPLC). Partial differentiating (Eq. 1) with respect to wavelength gives
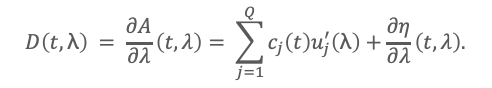
Suppose component q is unwanted, and there exists a wavelength λ* such that u’q(λ*) = 0. Then, at λ=λ*,
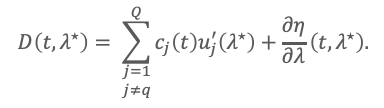
Equation (3) is the central principle used in this application note: the undesired component disappears in the derivative domain, while the remaining components persist, and are scaled by their slopes at λ*. Thus, unresolved chromatographic overlap can be converted into spectral selectivity in the derivative domain.
Illustration of a Two-Component Enantiomeric System
In many chiral analyses, certain compounds have multiple chiral centers, leading to multiple peaks in a single spectrum. This allows us to eliminate several interfering peaks simultaneously. Consider a two-component system:
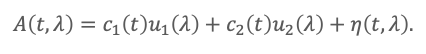
If λ*1 satisfies u’1(λ*1) = 0, then
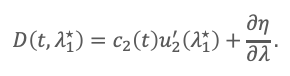
Hence, when u′2 (λ*1) ≠ 0, and the residual derivative term is small, c2 (t)∝D(t,λ*1). Similarly, if u’2 (λ*2) = 0, then c1 (t)∝D(t,λ*2). This shows why DeSC can recover a hidden component from a single unresolved chromatographic envelope: each analyte can be isolated at a wavelength where the other is spectrally “zeroed” in the derivative sense.
Numerical Implementation
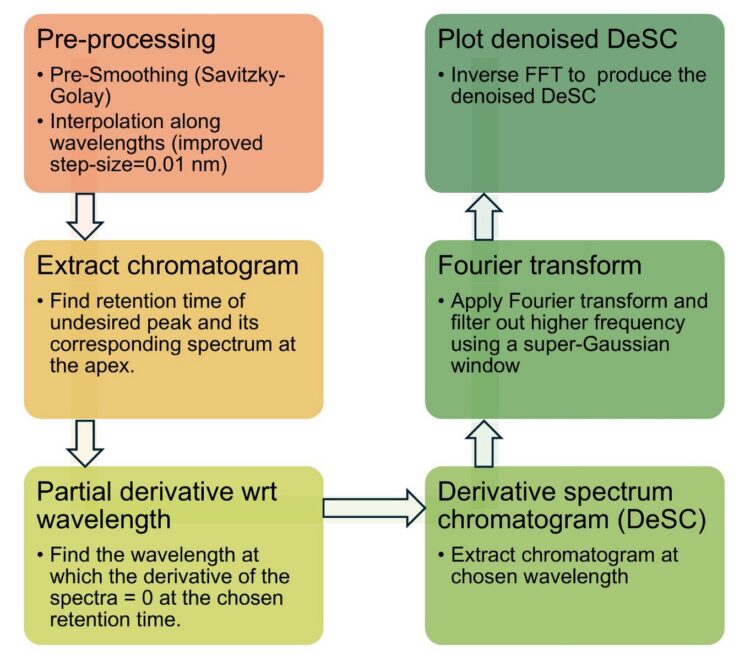
Because differentiation enhances high-frequency noise, this application note applies Savitzky-Golay pre-smoothing and differentiation, interpolation along the wavelength axis to refine zero-crossing locations, and a super-Gaussian filter in the Fourier domain to suppress residual noise [3, 6]. Reflection padding is used to reduce boundary artifacts introduced by convolution-based smoothing [3]. For gradient methods, baseline drift must be corrected by subtracting the PDA matrix of a blank run before DeSC extraction. All the steps are summarized in Figure 1.
Experimental
No special arrangements or instrumentation are needed to generate DeSC. A standard JASCO UHPLC/HPLC with PDA capability will suffice. The data were acquired with a step size of 1 nm. Chromatographic data were acquired on a JASCO RHPLC system consisting of a degasser, a PU-4180 binary pump with an active mixer, an AS-4150 autosampler with a 5 𝜇L loop, a CO-4062 column oven, and an MD-4010 photodiode-array detector. The system was controlled with ChromNAV version 2.0, and PDA signals were collected at 50 Hz using the “Fast” response setting. The exported PDA matrices were then processed numerically for DeSC extraction using Savitzky-Golay-based preprocessing and subsequent computational analysis. If readers wish to implement this in MATLAB, they should have the “Signal Processing Toolbox” to access the built-in “sgolay” function. See (https://www.mathworks.com/products/signal.html) for more information. The full MATLAB® code for DeSC is described in the Supporting File of reference [3], which includes trial data. With the availability of modern generative AI, code can be readily translated into Python.
Illustrative Examples of DeSC in Enantiomeric/Isomeric Analysis
Chemometric Elimination of an Amino Acid Enantiomer From a Chromatogram.
Chiral amino acid analysis is important in biochemical, food, and clinical investigations. The ratios of D- and L-isomers often contain information about disease biomarkers [7, 8]. Since there are more than 900 amino acids [9] (of biogenic and non-biogenic origins), there is a high likelihood of peak overlap in liquid chromatography in real mixtures. A racemic phenylalanine–tryptophan mixture was separated on a 150 mm × 3 mm i.d., 2.7 μm TeicoShell column (AZYP, LLC, Arlington, TX) using a 30/70 (v/v) acetonitrile/50 mM ammonium formate mobile phase at pH 3.6 and a flow rate of 0.20 mL min-1. When the data matrix was viewed as a conventional chromatogram at 220 nm, the enantiomeric pairs of DL-tryptophan (1, 1′) and DL-phenylalanine (2, 2′) were visible. The D-amino acid elutes later in each case. However, one peak from the tryptophan pair fully overlapped with one peak from the phenylalanine pair, as shown in Figure 2. Consequently, the central portion of the chromatogram could not be assigned reliably from the single-wavelength trace alone.
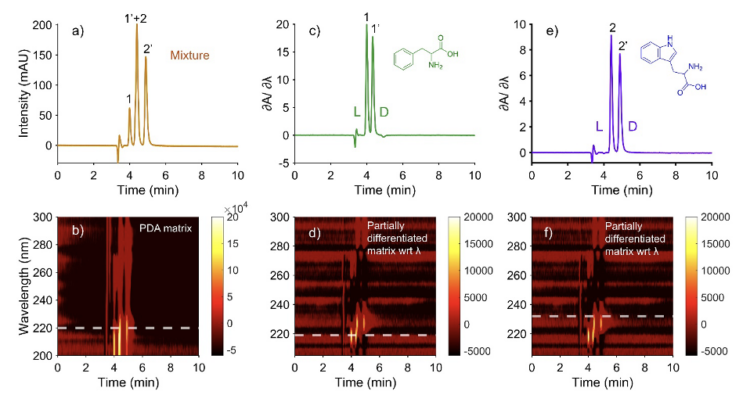
The protocol given in Figure 1 was then applied to the differentiated PDA matrix to generate selective chromatograms at derivative zero-crossing wavelengths. A spectrum extracted at t = 3.99 min yielded a zero crossing at 219.56 nm, and the corresponding DeSC resolved one enantiomeric pair. Note that the two decimal places in the wavelengths come from interpolation. A second spectrum extracted at t = 4.88 min yielded a zero crossing at 231.67 nm, producing the complementary resolved pair. In agreement with Figure 2a, the DeSC extracted at 219.56 nm corresponds to peaks 1 and 1′ (Figure 2c), whereas the DeSC extracted at 231.67 nm corresponds to peaks 2 and 2′ (Figure 2e). This example shows that derivative-domain extraction can transform a partially overlapped chiral chromatogram into two selective traces without altering retention behavior or relative peak-area relationships. More broadly, it demonstrates that the spectral dimension of PDA data contains sufficient structure to recover chemically interpretable enantiomeric information even when a conventional UV chromatogram remains partially clustered by co-elution.
Application of DeSC on Stereoisomeric Analysis of Agrochemicals
Chiral analysis is especially important in agrochemical samples because a single active ingredient can appear as a family of stereoisomers rather than as one chromatographic peak. In practice, this increases chromatographic complexity and can obscure analyte-specific information, even when multiple chiral stationary phases are available. Herein, we illustrate this point in a pesticide/fungicide example. Although the stereoisomeric peaks were substantially separated, several signals from the two analytes still overlapped, making the conventional chromatogram difficult to interpret. In this setting, DeSC is valuable because it operates on the full PDA data matrix and can suppress the spectral contribution of one analyte family while retaining the other, thereby converting a crowded chiral chromatogram into analyte-selective peak profiles.
The two compounds chosen for this demonstration were allethrin and bromuconazole. Allethrin is a pyrethroid containing three chiral centers, which gives rise to eight possible stereoisomers. Bromuconazole is a triazole fungicide with two chiral centers, resulting in four possible stereoisomers. This stereochemical multiplicity is the challenge: each analyte contributes several peaks to the chiral separation, so the problem is not simply binary overlap between two compounds but overlap between two clusters of stereoisomeric signals (see Figure 3). As is well known, enantiomers are spectrally identical but diastereomers of the same analyte; although not identical, they exhibit extremely similar UV-Vis absorption spectra. That shared spectral structure is what allows DeSC to eliminate multiple peaks from enantiomers and diastereomers.
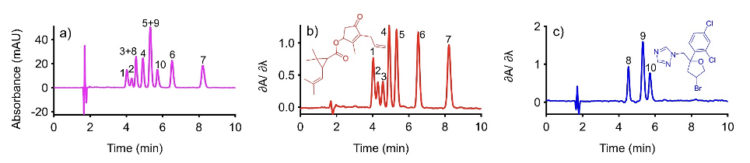
Conditions: Column: CDShell-RSP, 150 mm x 4.6 mm (i.d.) 2.7 µm SPP, 30:70 (v/v), Mobile phase: acetonitrile:16 mM ammonium formate, pH 3.6 (adjusted with the addition of formic acid), 0.90 mL/min.
The chromatographic separation was carried out on a CDShell-RSP column (AZYP LLC, Arlington, TX) in reversed-phase mode. In the conventional chromatogram, several stereoisomeric peaks from allethrin and bromuconazole overlapped, which made direct interpretation difficult (Figure 3a). To recover the allethrin peak profile, the derivative spectrum of bromuconazole was evaluated at 5.72 min, and the zero-derivative wavelength was identified at 244.06 nm. After DeSC extraction of the allethrin profile, a reader will observe seven peaks instead of the expected eight. This occurs because two of the isomers co-elute. DeSC cannot isolate profiles when the spectra are identical. To the best of our knowledge, no commercial column can separate all eight allethrin isomers, and no known chemometric methods can “isolate” two distinct peak profiles from fully overlapped peaks when their optical absorption spectra are highly similar. Extracting the derivative spectrum chromatogram at 244.06 nm eliminated the bromuconazole contribution and revealed the allethrin peaks more clearly (Figure 3b). In the other case, the derivative spectrum of allethrin was evaluated at 4.02 min, yielding a zero crossing at 228.83 nm. Extraction at 228.83 nm suppressed the allethrin signal, allowing selective observation of the bromuconazole peaks (Figure 3c). After DeSC extraction of the bromuconazole profile, three peaks are observed instead of four due to a co-elution event, as seen with allethrin. This example shows that DeSC can recover hidden stereoisomeric peak structure from a partially overlapped chiral chromatogram without changing the chromatographic conditions, because the selectivity is obtained from the spectral dimension of the PDA data rather than from additional physical separation.
Application of DeSC on Illicit Drugs and Selective Removal of Unknown Co-Eluting Impurities.
Enantiomeric analysis is also critical for illicit drugs such as tianeptine because this compound is both pharmacologically unusual and used as a recreational substance. It is not fully understood how its enantiomers affect the human brain. Overall, its opioid-like behavior is central to its abuse potential and explains why the drug has appeared in recreational markets under the name “gas station heroin” [10]. The molecular structure of tianeptine contains a dibenzothiazepine S,S-dioxide core bearing a secondary amine and a carboxylic acid side chain. It is also an optically active molecule with a single stereogenic center, corresponding to two enantiomers. In the reported chiral separations, S-tianeptine is the first-eluting peak and R-tianeptine is the second-eluting peak based on vibrational circular dichroism studies [10].
Figure 4 presents a practical example of how DeSC can be used for quantitation when a target analyte is masked by a co-eluting impurity in a real sample. In the original chromatogram of a commercial tianeptine-containing product, measured at 254 nm, a major impurity overlaps the tianeptine peak, rendering direct integration unreliable (Figure 4a). This illustrates an important analytical problem: a method that performs well on clean standards may fail on real products when additional formulation components generate interfering peaks. In this case, the derivative spectrum was examined at 2.27 min, and the impurity was found to have a zero-derivative wavelength at 247.23 nm. When the derivative spectrum chromatogram was extracted at 247.23 nm, the impurity contribution was digitally suppressed, allowing the tianeptine enantiomers to become selectively observable (Figure 4b).
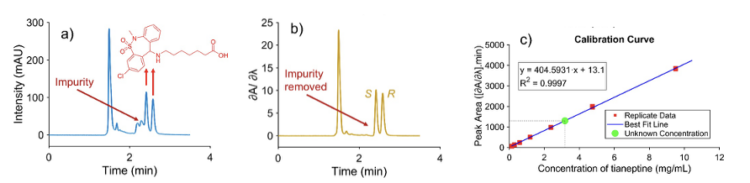
Conditions: Column: NicoShell, 150 mm x 3 mm (i.d.) 2.7 µm SPP, Mobile phase: 100:0.35:0.05 (v/v), methanol: acetic acid: ammonium hydroxide, 0.425 mL/min. The first peak is the S-enantiomer, and the second peak is the R-enantiomer [10].
The figure also shows that the transformed DeSC signal cannot be quantified using the original absorbance calibration, as derivative-domain processing alters peak areas. For that reason, the same DeSC extraction at 247.23 nm was applied to the calibration standards, and a new calibration curve was built from the transformed responses. Using this matched calibration, the tianeptine concentration in the product was determined to be 3.18 mg/mL, with a reported R2 of 0.9997 (Figure 4c). As another benefit of intelligent denoising algorithms, a lower limit of detection of 0.025 mg/mL after DeSC processing, compared with 0.039 mg/mL before the algorithm was applied, was achieved. We note that the PDA response variance was heteroscedastic, so the reported detection limits should always be interpreted with appropriate caution [3].
Taken together, Figure 4 shows the full analytical value of the method in a form well suited to an application note. The DeSC workflow begins with a real overlap problem in a commercial or illicit sample, then uses derivative-domain selectivity to remove the interfering impurity and finally restores valid quantitation by recalibrating in the same transformed domain. This application note confirms that DeSC is not only a qualitative peak-clarification tool; it is also a practical quantitative strategy for samples in which ordinary chromatographic integration is compromised by co-eluting impurities.
Conclusion
HPLC-PDA users should exploit the full second-order advantage of JASCO’s reliable photodiode-array technology and couple it with robust signal processing algorithms. DeSC is a reliable technique when used with spectrally different overlapping impurities or interfering compounds. The full code is publicly available for readers to try the DeSC approach on their difficult enantiomer examples, rather than purchasing and screening new chiral column chemistries.
References
[1] K.S. Booksh, B.R. Kowalski, Theory of analytical chemistry, Analytical Chemistry 66(15) (1994) 782A-791A.
[2] J.R. Torres-Lapasió, S. Pous-Torres, C. Ortiz-Bolsico, M.C. García-Alvarez-Coque, Optimisation of chromatographic resolution using objective functions including both time and spectral information, Journal of Chromatography A 1377 (2015) 75-84.
[3] S.J. Sajeevan J, M.F. Wahab, D.W. Armstrong, Selective chemometric elimination of co-eluting components in chiral and achiral liquid chromatographic analyses, Analytical Chemistry 97(34) (2025) 18795-18803.
[4] A. Yamamoto, A. Matsunaga, M. Ohto, E. Mizukami, K. Hayakawa, M. Miyazaki, Real-time analysis of multicomponent chromatograms: application to high-performance liquid chromatography, Analyst 120(2) (1995) 377-380.
[5] T.C. O’Haver, T. Begley, Signal-to-noise ratio in higher order derivative spectrometry, Analytical Chemistry 53(12) (1981) 1876-1878.
[6] M.F. Wahab, F. Gritti, T.C. O’Haver, Discrete Fourier transform techniques for noise reduction and digital enhancement of analytical signals, TrAC Trends in Analytical Chemistry 143 (2021) 116354.
[7] D.W. Armstrong, A. Berthod, Occurrence of D-amino acids in natural products, Natural Products and Bioprospecting 13(1) (2023) 47.
[8] G. Genchi, An overview on D-amino acids, Amino Acids 49(9) (2017) 1521-1533.
[9] S. Martínez-Rodríguez, J.M. Torres, P. Sánchez, E. Ortega, Overview on multienzymatic cascades for the production of non-canonical α-amino acids, Frontiers in Bioengineering and Biotechnology Volume 8 – 2020. 10.3389/fbioe.2020.00887
[10] S. Aslani, J. Nafie, M.F. Wahab, D.W. Armstrong, Tianeptine: enantiomeric separations, structural assignment, and biological interactions, Talanta 294 (2025) 128197.