Gas Analysis System using Full Vacuum FTIR spectrometer (Trace levels of H2O in N2 gas)
August 25, 2022
Introduction
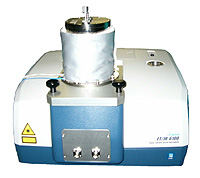
Trace gas analysis of low concentration of gases using FTIR spectroscopy with long path length gas cells has been reported previously, however, it is difficult to accurately quantitate gases at low concentrations when the absorption peaks of the target gas overlap with the peaks of atmospheric water vapor or, when the target gas itself is H2O or CO2, which are present in significant amounts in the atmosphere. A key drawback to the use of a vacuum FTIR spectrometer, is that it has not been possible to evacuate the sample chamber with a long path length cell present. The full vacuum gas analysis system introduced in this application note has a special gas cell integrated into the sample chamber, allowing the entire light path to remain under full vacuum with the gas cell in place. This full vacuum model makes it possible to quantitate concentrations of H2O down to 0.1 ppm levels.
Instrument and Measurement
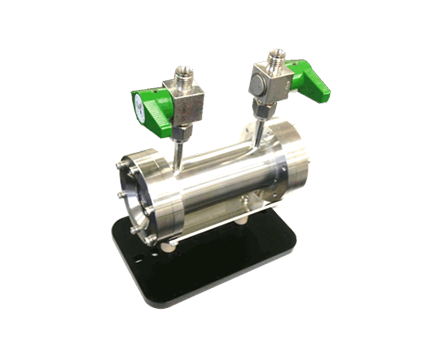
For the measurement, there are separate vacuum lines for evacuation of the FTIR spectrometer and the gas cell, with independent evacuation capability for the separate components. Adding a vacuum gauge to the gas cell makes it possible to control extremely low concentrations of the gas samples.

Cell Specification
| Cell Type: | Multi-pass 'White' cell |
| Pathlength: | 10 meter |
| Cell Body: | Stainless steel |
| Mirror Material: | Stainless steel |
| Mirror Surface: | Gold coated |
| O-Ring: | Viton |
| Window: | CaF2 |
| Heating: | Possible, max. 100°C |
| Cell capacity: | Approx. 2 L |
| Gas in/output port: | 1/4 inch VCR |
Experimental
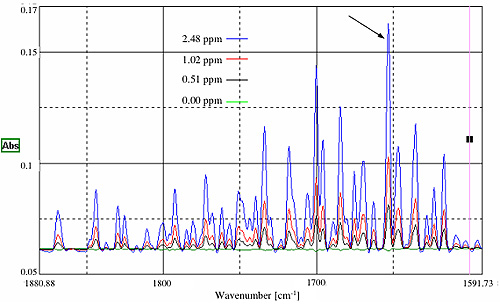
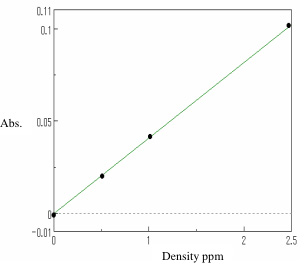
The quantitation of a trace levels of water vapor (H2O) in nitrogen gas was made. Water vapor with a concentration of 100 ppm was diluted by monitoring the pressure gauge during dilution of the standard samples with concentrations of 0.0, 0.51, 1.02 and 2.48 ppm. Figure 2 shows the IR spectra of water vapor for each concentration. For the 0 ppm concentration, there was no absorption due to water vapor observed in the spectrum. The calibration curve in Figure 3 was created using the absorption peak at 1653 cm-1.


Conditions
| Instrument: | FT/IR-6100 |
| Accumulations: | 200 |
| Resolution: | 2 cm-1 |
| Apodization: | Cosine |
| Gain: | Auto (1) |
| Aperture: | 1.8 mm |
| Scan speed: | Auto (4 mm/sec.) |
| Light source: | Standard |
| Detector: | MCT |
Keywords
230TR0187-E Gas analysis Full vacuum FTIR spectrometer moisture analysis water analysis H2O analysis
Featured Products:

Gas Analysis System using Full Vacuum FTIR spectrometer (Trace levels of H2O in N2 gas)
Introduction
Trace gas analysis of low concentration of gases using FTIR spectroscopy with long path length gas cells has been reported previously, however, it is difficult to accurately quantitate gases at low concentrations when the absorption peaks of the target gas overlap with the peaks of atmospheric water vapor or, when the target gas itself is H2O or CO2, which are present in significant amounts in the atmosphere. A key drawback to the use of a vacuum FTIR spectrometer, is that it has not been possible to evacuate the sample chamber with a long path length cell present. The full vacuum gas analysis system introduced in this application note has a special gas cell integrated into the sample chamber, allowing the entire light path to remain under full vacuum with the gas cell in place. This full vacuum model makes it possible to quantitate concentrations of H2O down to 0.1 ppm levels.
Instrument and Measurement
For the measurement, there are separate vacuum lines for evacuation of the FTIR spectrometer and the gas cell, with independent evacuation capability for the separate components. Adding a vacuum gauge to the gas cell makes it possible to control extremely low concentrations of the gas samples.

Cell Specification
| Cell Type: | Multi-pass 'White' cell |
| Pathlength: | 10 meter |
| Cell Body: | Stainless steel |
| Mirror Material: | Stainless steel |
| Mirror Surface: | Gold coated |
| O-Ring: | Viton |
| Window: | CaF2 |
| Heating: | Possible, max. 100°C |
| Cell capacity: | Approx. 2 L |
| Gas in/output port: | 1/4 inch VCR |
Experimental
The quantitation of a trace levels of water vapor (H2O) in nitrogen gas was made. Water vapor with a concentration of 100 ppm was diluted by monitoring the pressure gauge during dilution of the standard samples with concentrations of 0.0, 0.51, 1.02 and 2.48 ppm. Figure 2 shows the IR spectra of water vapor for each concentration. For the 0 ppm concentration, there was no absorption due to water vapor observed in the spectrum. The calibration curve in Figure 3 was created using the absorption peak at 1653 cm-1.


Conditions
| Instrument: | FT/IR-6100 |
| Accumulations: | 200 |
| Resolution: | 2 cm-1 |
| Apodization: | Cosine |
| Gain: | Auto (1) |
| Aperture: | 1.8 mm |
| Scan speed: | Auto (4 mm/sec.) |
| Light source: | Standard |
| Detector: | MCT |
Keywords
230TR0187-E Gas analysis Full vacuum FTIR spectrometer moisture analysis water analysis H2O analysis

 Download This Application
