Imaging measurement and particle characterization of microplastics using infrared microscopy
January 5, 2024
Introduction

Microplastics are generally defined as polymer particles smaller than 5 mm. In recent years, they have been found in seas, rivers, soil, air, marine life and drinking water. As a result there is rapidly growing interest in the health hazards of microplastics to the human body.
Research on microplastics has been carried out from various fields using many different analytical techniques. One of the tools for investigating microplastics is infrared microscopy, which can measure microplastics without complicated pretreatment and can determine the type of plastic from spectral databases. In addition, imaging measurement enables not only qualitative analysis but also composition ratio calculation and particle size analysis.
Here we introduce the results of particle analysis of microplastics measured with an infrared imaging microscope.
Experimental
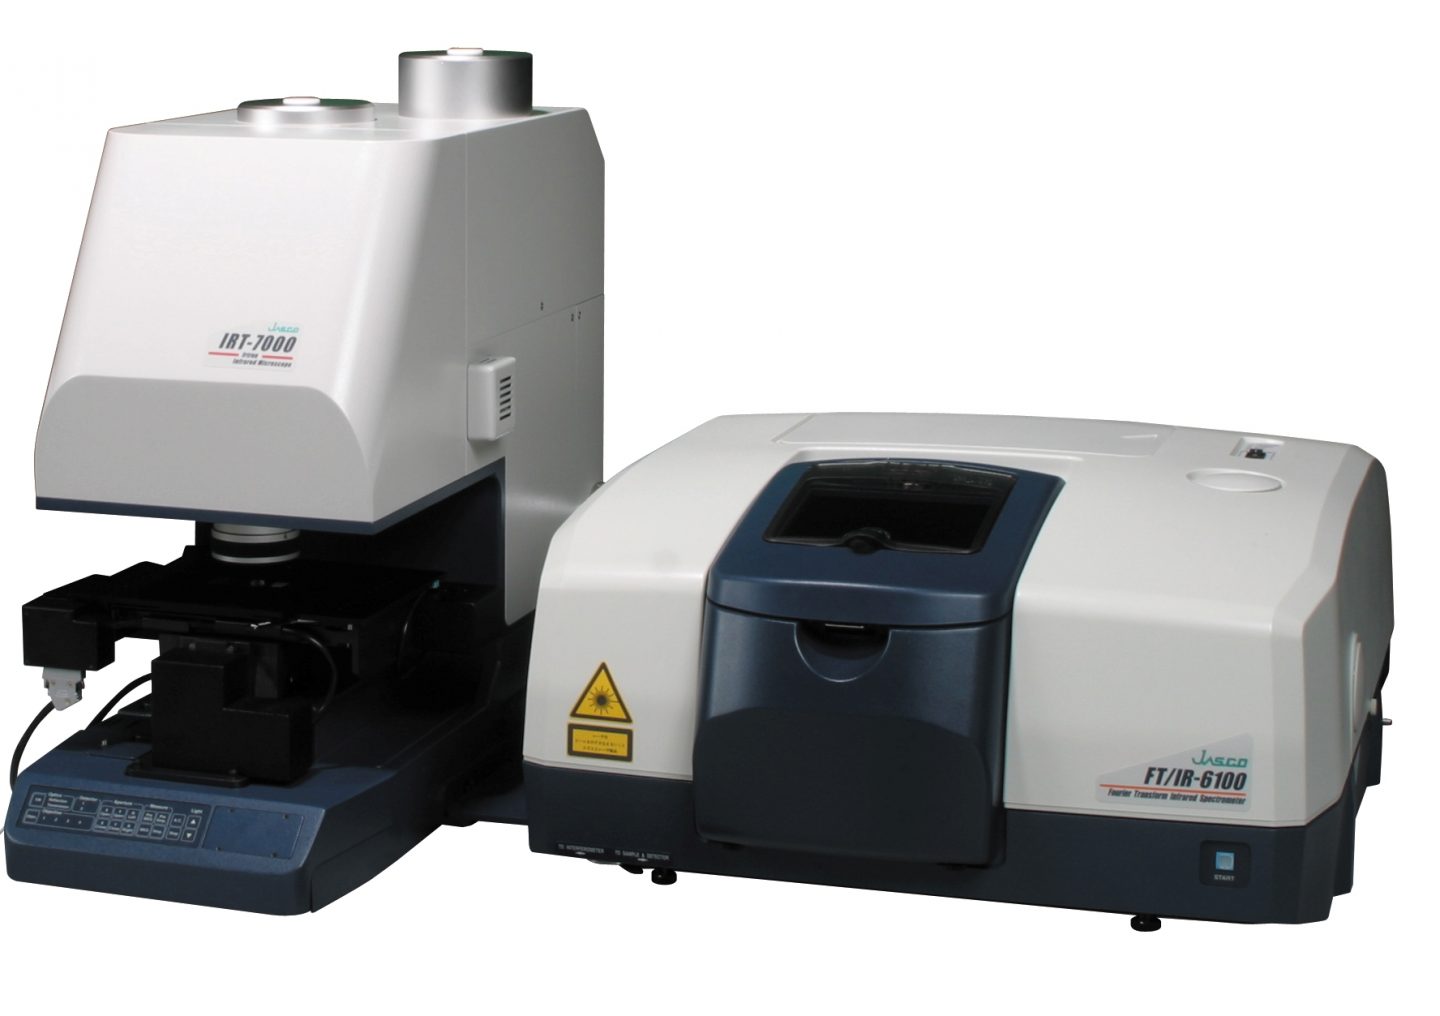
Five resins*1 were mixed and dispersed in a solvent and collected in a filter (Material: PTFE) and IR imaging measurement was performed, with measurement conditions as follows:
| Instruments | FT/IR-6700 | Fourier Transform Infrared Spectrometer |
| IRT-7200 | Linear-Array Infrared Microscope | |
| Measurement Area | 1.3 x 1.3 mm | |
*1 Five resins used:
- Polyethylene (PE)
- Polypropylene (PP)
- Polystyrene (PS)
- Polyethylene terephthalate (PET)
- Polyvinyl chloride (PVC)
Keywords
100-MT-0262, FTIR Microscopy, microplastics, particle analysis, particle distribution, histogram
Results
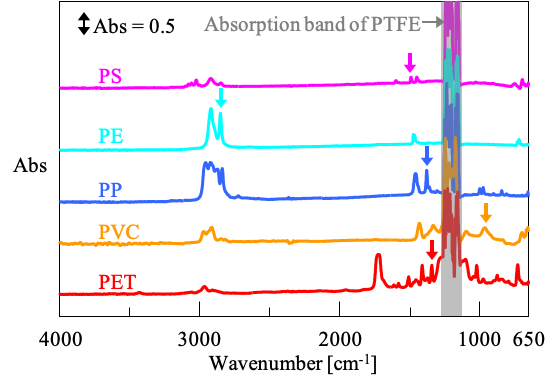
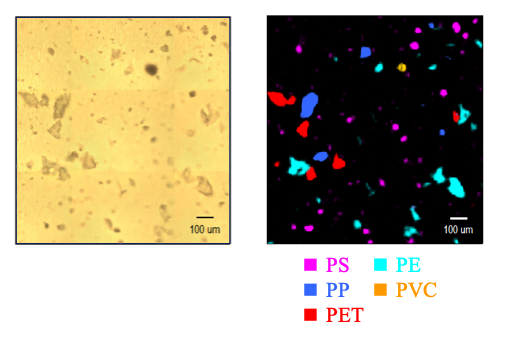
Figure 1 shows the average spectrum of each component obtained by imaging measurement. There is little interference by the C-F bonds in the PTFE away from the polymer peaks of interest. Figure 2 shows the results of creating a chemical image using the peak heights indicated by the arrows in the spectrum shown in Figure 1. By creating chemical false-color maps, the component distribution of the five plastics could be visualized.
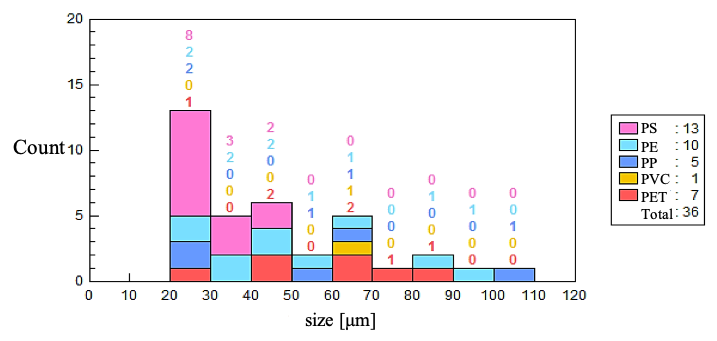
Furthermore, as an example of particle analysis, Figure 3 shows the results of creating a stacked histogram for the distribution of each component. Using JASCO’s particle analysis software [JASCO Particle Analysis*2], particle analysis using both observation images and chemical images can be performed.
*2 In [JASCO Particle Analysis] program size, area, circularity, aspect ratio of each particle can be determined, also histograms (convertible to stacked histograms) of frequency distribution tables and correlation distributions can be easily created.
Conclusion


Using an infrared microscope, plastic particles can be identified, and their physical properties measured, such as size and circularity. Histograms can be created based on the results to capture trends in the sample. Functional group analysis presented here is not limited to microplastics, it is equally useful in the analysis of resins, foods, and tablets.
References
The sample and the measurement data by infrared microscope were provided by TOSOH Analysis and Research Center Co., Ltd.
Reference: TOSOH Analysis and Research Center Co., Ltd. Technical Report No. T1917

Imaging measurement and particle characterization of microplastics using infrared microscopy
Introduction

Microplastics are generally defined as polymer particles smaller than 5 mm. In recent years, they have been found in seas, rivers, soil, air, marine life and drinking water. As a result there is rapidly growing interest in the health hazards of microplastics to the human body.
Research on microplastics has been carried out from various fields using many different analytical techniques. One of the tools for investigating microplastics is infrared microscopy, which can measure microplastics without complicated pretreatment and can determine the type of plastic from spectral databases. In addition, imaging measurement enables not only qualitative analysis but also composition ratio calculation and particle size analysis.
Here we introduce the results of particle analysis of microplastics measured with an infrared imaging microscope.
Experimental
Five resins*1 were mixed and dispersed in a solvent and collected in a filter (Material: PTFE) and IR imaging measurement was performed, with measurement conditions as follows:
| Instruments | FT/IR-6700 | Fourier Transform Infrared Spectrometer |
| IRT-7200 | Linear-Array Infrared Microscope | |
| Measurement Area | 1.3 x 1.3 mm | |
*1 Five resins used:
- Polyethylene (PE)
- Polypropylene (PP)
- Polystyrene (PS)
- Polyethylene terephthalate (PET)
- Polyvinyl chloride (PVC)
Results
Figure 1 shows the average spectrum of each component obtained by imaging measurement. There is little interference by the C-F bonds in the PTFE away from the polymer peaks of interest. Figure 2 shows the results of creating a chemical image using the peak heights indicated by the arrows in the spectrum shown in Figure 1. By creating chemical false-color maps, the component distribution of the five plastics could be visualized.
Furthermore, as an example of particle analysis, Figure 3 shows the results of creating a stacked histogram for the distribution of each component. Using JASCO’s particle analysis software [JASCO Particle Analysis*2], particle analysis using both observation images and chemical images can be performed.
*2 In [JASCO Particle Analysis] program size, area, circularity, aspect ratio of each particle can be determined, also histograms (convertible to stacked histograms) of frequency distribution tables and correlation distributions can be easily created.
Conclusion


Using an infrared microscope, plastic particles can be identified, and their physical properties measured, such as size and circularity. Histograms can be created based on the results to capture trends in the sample. Functional group analysis presented here is not limited to microplastics, it is equally useful in the analysis of resins, foods, and tablets.
Keywords
100-MT-0262, FTIR Microscopy, microplastics, particle analysis, particle distribution, histogram
References
The sample and the measurement data by infrared microscope were provided by TOSOH Analysis and Research Center Co., Ltd.
Reference: TOSOH Analysis and Research Center Co., Ltd. Technical Report No. T1917

 Download This Application