Luminous Color Measurement by UV-Visible Spectroscopy
January 5, 2024
 Download This Application
Introduction
Objects that emit light are known as luminous materials and are increasingly being used in products such as Light Emitting Diodes (LED), Organic Electrical Luminescent (EL) Displays, and Plasma Display Panels (PDP). After the introduction of the blue LED in 1993, engineers developed a white LED that is now the mainstream illuminator of the mobile phone backlight and LED flashlights. Commercial screen displays such as flat-screen organic EL displays have superior performance for luminous efficiency and lower power consumption. The development of these luminous materials require that manufacturers obtain numerical evaluations of the display colors, as well as the color rendering of the luminous body itself, and of the manufactured display.
In this application note, methods for evaluating luminous colors and color rendering by a JASCO UV-Visible spectrophotometer are introduced for the development of LED, Organic EL, and PDP displays. Moreover, a method for evaluating the colors of liquid crystal displays (LCD) using the same system is also introduced.
Experimental
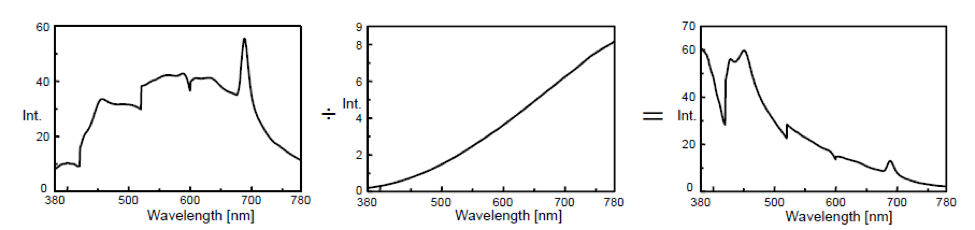
A spectrophotometer has varying grating efficiencies and detector sensitivities dependent on wavelength. Therefore, any collected spectrum can reflect the differences in these instrumental characteristics. To obtain the instrumental characteristics and later correct the spectrum for these discrepancies, a standard light source having a known emission must be used. Here, the emission spectrum of a standard light source will be referred to as the standard light source data, and the spectrum of the standard light source measured by the spectrophotometer will be the standard light source spectrum. The Instrument Correction Coefficient spectrum can be calculated by dividing the standard light source spectrum by the standard light source data, shown in Figure 1. Subsequent spectra measured using the spectrophotometer are corrected using the calculated Instrument Correction Coefficient spectrum.
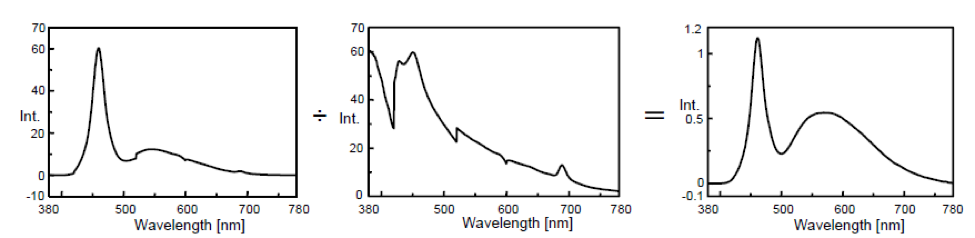
To correct a sample spectrum, a raw sample spectrum is divided by the correction coefficient spectrum, shown in Figure 2.
Keywords
190-UV-0006, V-650, V-660, V-670, UV-Visible/NIR spectrophotometer, VWLU-788 Luminous Color Program, ELM-742 External Source Fiber Optic interface, Luminous color, LED, OLED, EL Displays organic light emitting diode, electro luminescence
Results
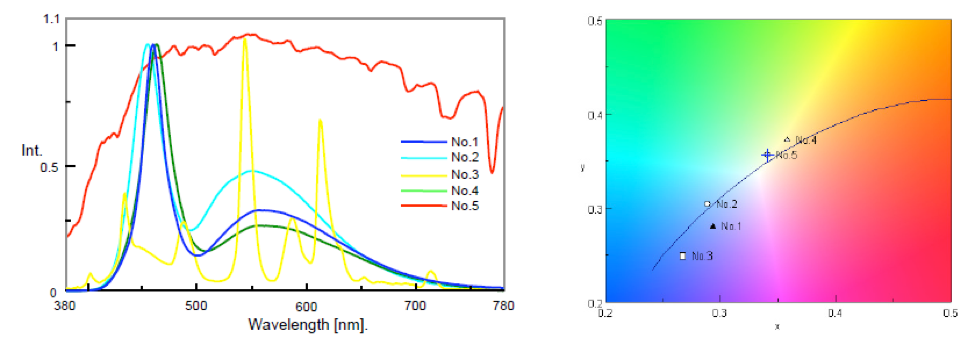
Three white LED’s, a fluorescent lamp, and sunlight were measured to calculate the Color Rendering Index and the Correlated Color Temperature of illumination sources. The Color Rendering Index quantitatively determines how accurately a light source renders all colors and is reported on a scale of 0 to 100%. The Correlated Color Temperature measures the color characteristics of the light at varying wavelengths, such as warmth or coolness.
The Color Rendering and Correlated Color Temperature results are shown in Figure 3 and Table 1. The white LEDs showed good Color Rendering Index (Ra) with a high Correlated Color Temperature (Tcp) which indicate that the color of the white LEDs differed according to their types, some of which demonstrated a deeper blue color. Sunlight provides a Ra of almost 100, while the fluorescent lamp demonstrates a slightly smaller Ra.
The screen of a liquid crystal display was measured when it was programmed to illuminate as white, red, blue, green, yellow, light blue, and deep red. The spectra were calculated using the color calculation program and are shown in Figure 4 and Table 2.
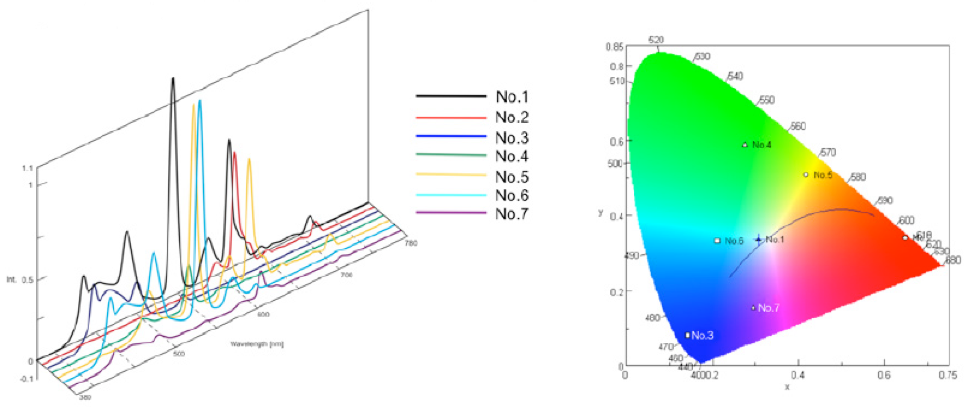
The tristimulus XYZ values describe the luminance of the color while the chromaticity values describe the quality of the color. These values, along with the color space map, quantitatively correlate color sensation with physical color in the electromagnetic spectrum.
The XYZ values were converted into RGB values and compared with the values of the display settings (Table 3). Although the calculated RGB values demonstrated relatively different values than those set for the display, it can be considered that the results were a reasonable match, based on the predominant values for the RGB calculations vs. the display settings.
Featured Products:
-
A high resolution UV-Visible double-beam, double-monochromator spectrophotometer with exceptional stray light and absorbance linearity
V-760 UV-Visible Spectrophotometer
-
Wide range UV-Visible/Near Infrared Spectrophotometer with PbS detector for wavelengths up to 3200nm
V-770 UV-Visible/NIR Spectrophotometer

Luminous Color Measurement by UV-Visible Spectroscopy
Introduction
Objects that emit light are known as luminous materials and are increasingly being used in products such as Light Emitting Diodes (LED), Organic Electrical Luminescent (EL) Displays, and Plasma Display Panels (PDP). After the introduction of the blue LED in 1993, engineers developed a white LED that is now the mainstream illuminator of the mobile phone backlight and LED flashlights. Commercial screen displays such as flat-screen organic EL displays have superior performance for luminous efficiency and lower power consumption. The development of these luminous materials require that manufacturers obtain numerical evaluations of the display colors, as well as the color rendering of the luminous body itself, and of the manufactured display.
In this application note, methods for evaluating luminous colors and color rendering by a JASCO UV-Visible spectrophotometer are introduced for the development of LED, Organic EL, and PDP displays. Moreover, a method for evaluating the colors of liquid crystal displays (LCD) using the same system is also introduced.
Experimental
A spectrophotometer has varying grating efficiencies and detector sensitivities dependent on wavelength. Therefore, any collected spectrum can reflect the differences in these instrumental characteristics. To obtain the instrumental characteristics and later correct the spectrum for these discrepancies, a standard light source having a known emission must be used. Here, the emission spectrum of a standard light source will be referred to as the standard light source data, and the spectrum of the standard light source measured by the spectrophotometer will be the standard light source spectrum. The Instrument Correction Coefficient spectrum can be calculated by dividing the standard light source spectrum by the standard light source data, shown in Figure 1. Subsequent spectra measured using the spectrophotometer are corrected using the calculated Instrument Correction Coefficient spectrum.
To correct a sample spectrum, a raw sample spectrum is divided by the correction coefficient spectrum, shown in Figure 2.
Results
Three white LED’s, a fluorescent lamp, and sunlight were measured to calculate the Color Rendering Index and the Correlated Color Temperature of illumination sources. The Color Rendering Index quantitatively determines how accurately a light source renders all colors and is reported on a scale of 0 to 100%. The Correlated Color Temperature measures the color characteristics of the light at varying wavelengths, such as warmth or coolness.
The Color Rendering and Correlated Color Temperature results are shown in Figure 3 and Table 1. The white LEDs showed good Color Rendering Index (Ra) with a high Correlated Color Temperature (Tcp) which indicate that the color of the white LEDs differed according to their types, some of which demonstrated a deeper blue color. Sunlight provides a Ra of almost 100, while the fluorescent lamp demonstrates a slightly smaller Ra.
The screen of a liquid crystal display was measured when it was programmed to illuminate as white, red, blue, green, yellow, light blue, and deep red. The spectra were calculated using the color calculation program and are shown in Figure 4 and Table 2.
The tristimulus XYZ values describe the luminance of the color while the chromaticity values describe the quality of the color. These values, along with the color space map, quantitatively correlate color sensation with physical color in the electromagnetic spectrum.
The XYZ values were converted into RGB values and compared with the values of the display settings (Table 3). Although the calculated RGB values demonstrated relatively different values than those set for the display, it can be considered that the results were a reasonable match, based on the predominant values for the RGB calculations vs. the display settings.
Keywords
190-UV-0006, V-650, V-660, V-670, UV-Visible/NIR spectrophotometer, VWLU-788 Luminous Color Program, ELM-742 External Source Fiber Optic interface, Luminous color, LED, OLED, EL Displays organic light emitting diode, electro luminescence