Monitoring of Aggregates and Degradation Products by Size Exclusion Chromatography (SEC) in Forced Degradation Studies of Antibody based Pharmaceuticals
February 2, 2024 Download This Application
Introduction
Since the first monoclonal antibody (mAb) was approved by the U.S. Food and Drug Administration (FDA) in 1986, the market for therapeutic proteins has expanded rapidly, and antibody drugs have become the predominant treatment modality for a variety of diseases over the past 25 years 1). The stability of a drug molecule is very important because this affects its safety and efficacy. In products with higher order structures, such as antibody-based pharmaceuticals, the maintenance of molecular structure and biological activity depend on non-covalent bonds as well as covalent bonds in the molecule and can be affected by various environmental factors 2).
Contained in the guidelines of the FDA and International Council for Harmonization of Technical Requirements for Pharmaceuticals for Human Use (ICH), is the need for stability test data, which is performed to understand how the quality of drug substances and drug products change over time in different environments 3, 4). Forced Degradation Study (FDS), which purposely deteriorates and degrades the drugs, is required from the early stage of research and development through to marketing approval. FDS is an effective method for elucidating degradation pathways, as well as the structures of molecules formed during the degradation process. Also, it is useful for the development of manufacturing processes, formulation and selection of storage conditions, which includes the type of material required to be used as a container 5, 6). Common test conditions for FDS include heating, freezing and thawing, agitation, pH, light irradiation, oxidation, reduction, and glycation 7, 8). Since one of the degradation pathways that can occur under many of these conditions is aggregation, which are deeply related to immunogenicity, Size Exclusion Chromatography (SEC) is the method of choice for analysis. SEC can efficiently separate and detect monomers and aggregates, including multimers. 5, 7).
In this application note, we performed various FDS on MabThera® (rituximab), which is a therapeutic drug for non-Hodgkin’s lymphoma. Separations were made on untreated as well as forcibly degraded MabThera® by SEC to compare the changes in the amount of monomer and aggregates, including multimers, and degradation products.
Experimental
| Instruments | |
| Pump | PU-4080i* |
| Autosampler | AS-4050i* |
| Column Oven | CO-4060 |
| UV Detector | UV-4075* |
| *with option units | |
| Conditions | |||
| Column | TSKgel G3000SWXL (7.8 mmI.D. x 300 mmL, 5 µm) | Wavelength | 220 nm |
| Eluent | 0.2 mol/L sodium phosphate buffer (pH 6.7) | Injection Volume | 10 µL |
| Flow Rate | 0.8 mL/min | Standard | Protein standard mix 15 to 600 kDa (Merck) 30 mg/mL in water |
| Column Temperature | 25ºC | Sample | MabThera® 100 mg/10 mL (Roche) (Pretreatment methods are described later.) |
Keywords
biopharmaceutical, antibody drug, FDS, aggregate, protein degradation product, MabThera®, TSKgel G3000SWXL, SEC, UV detector, protein aggregation
Results
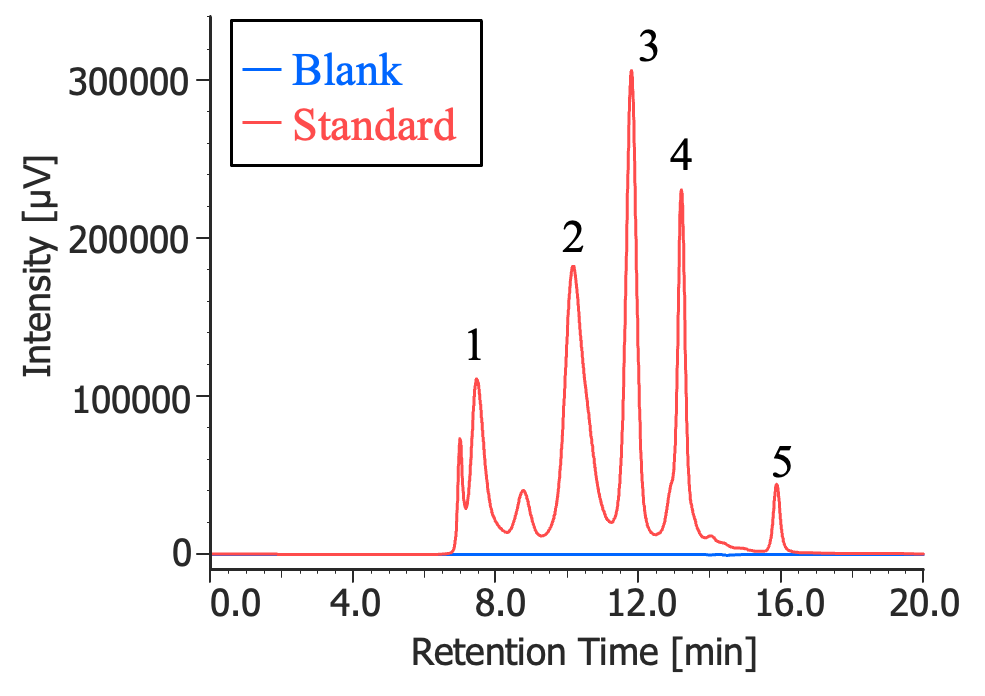
1: Thyroglobulin (670 kDa), 2: γ-globulins (150 kDa),
3: Ovalbumin (44.3 kDa), 4: Ribonuclease A (13.7 kDa),
5: p-amino-benzoic acid (0.137 kDa)
Figure 1 shows SEC chromatograms of a blank (ultrapure water) and a protein standard sample using a UV absorbance detector. The column used in this experiment has an exclusion limit for globular proteins of 800 kDa and measurement range of approximately 10 to 500 kDa. As shown in Figure 2, a molecular weight calibration curve was created from the retention times and molecular weights of the four components, except for p-aminobenzoic acid that eluted after the permeation limit (around 13.8 minutes). Based on this calibration curve, the molecular weights of each sample was calculated.
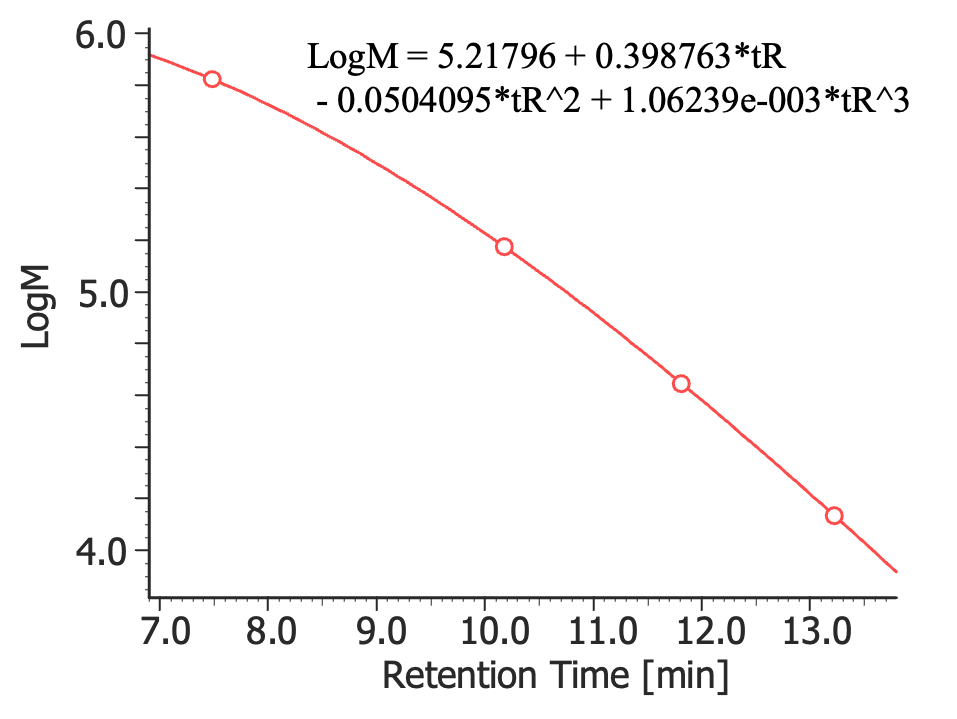
Figure 3 shows the UV chromatogram of MabThera® without degradation treatment. Figures 4 to 7 show UV chromatograms of MabThera® that had been oxidized, glycated, deamidated, and heated, respectively. In addition, Figures 8 to 10 show the UV chromatograms of light-irradiated MabThera® with the irradiation time changed in three steps of 1, 2, and 5 minutes. The peaks around 14 minutes in Figures 3 to 10 are the peaks that eluted after the permeation limit of the column. Although detailed calculation results of molecular weight are not shown here, the monomer peaks were identified from each peak’s top molecular weight in Figures 3 to 10.
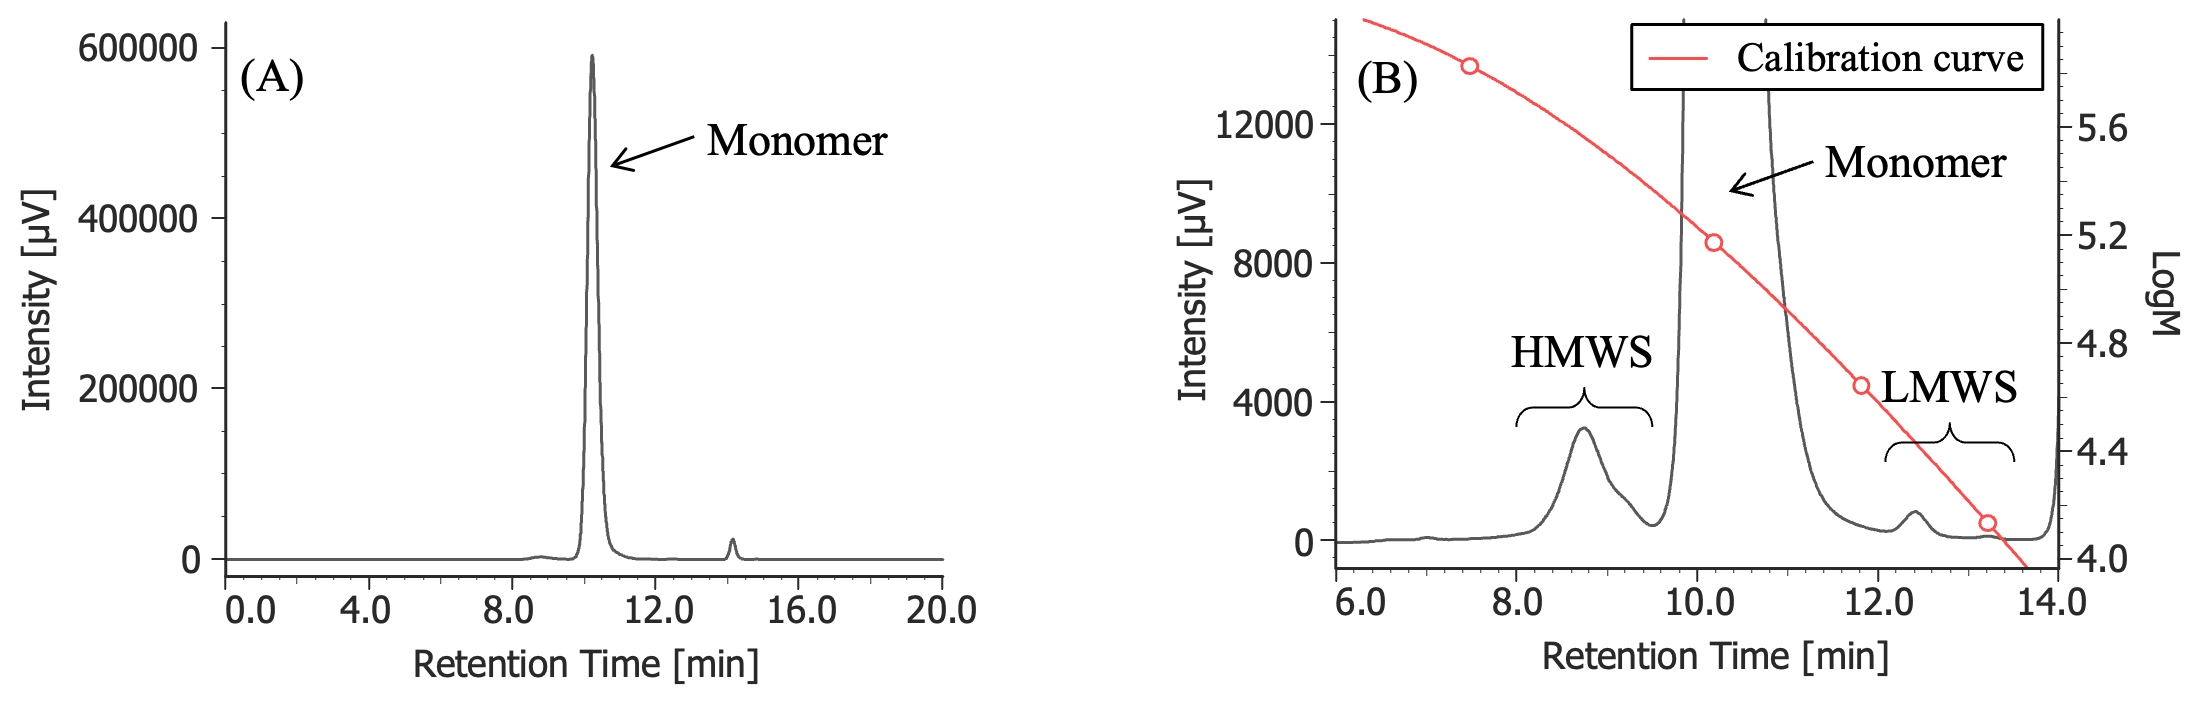
(A) : Full scale, (B) : Enlarged view near the baseline at 6-14 minutes (shown with molecular weight calibration curve)
Pretreatment: 100 mg/10 mL of MabThera® was diluted with ultrapure water to 1 mg/mL
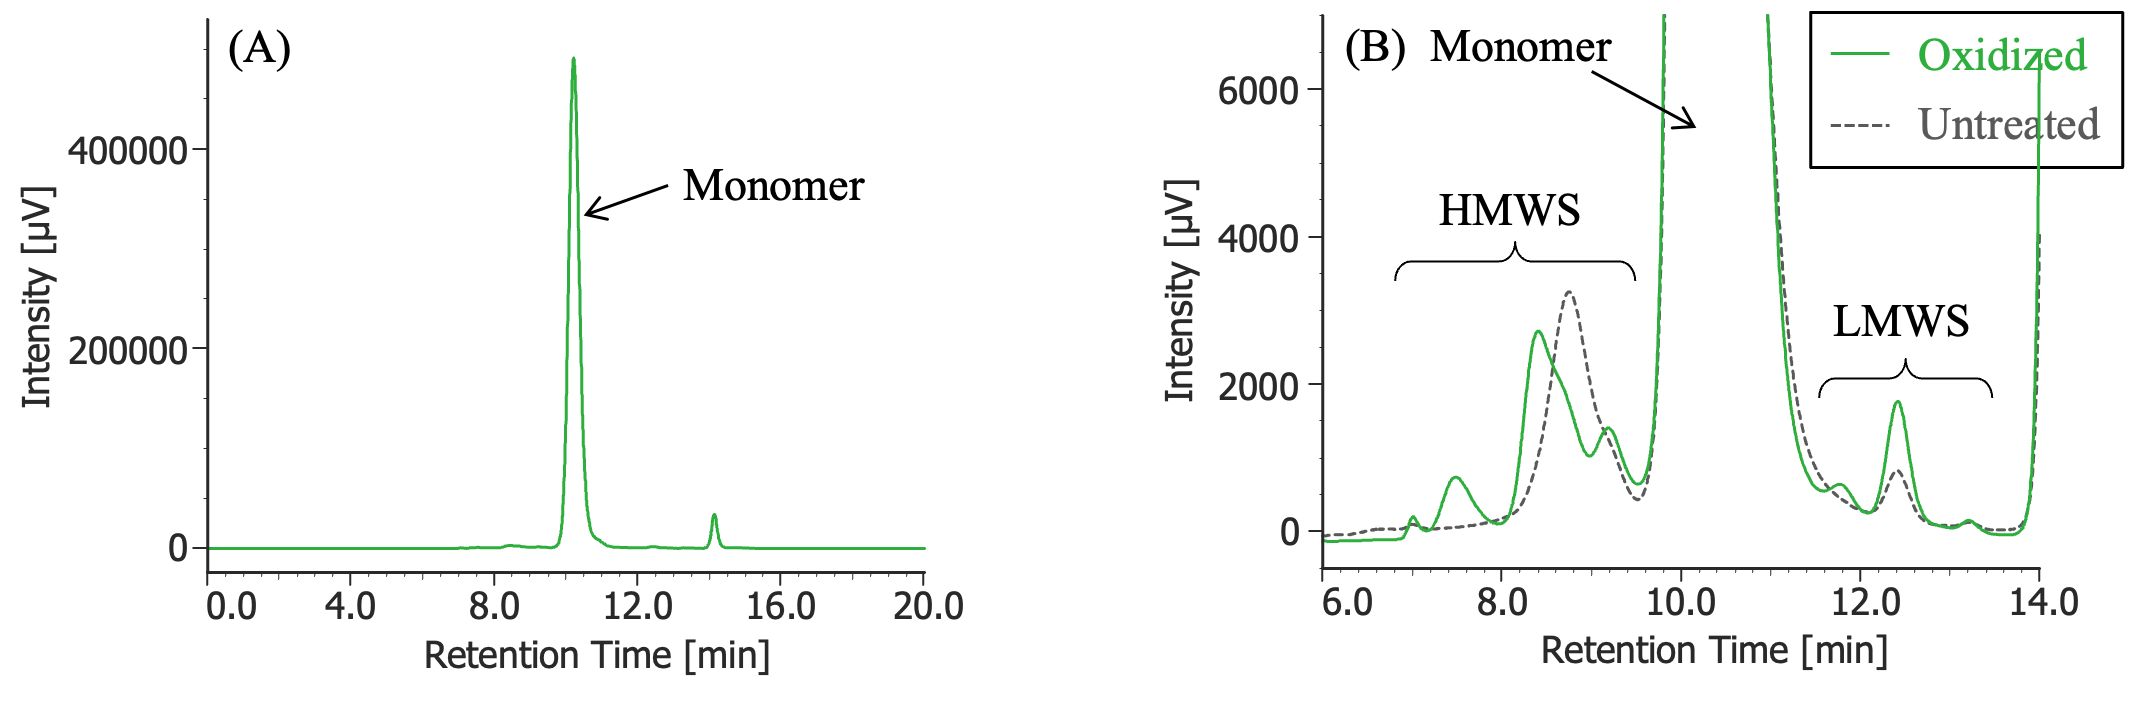
(A) : Full scale, (B) : Enlarged view near the baseline at 6-14 minutes (shown with chromatogram of untreated MabThera®
Pretreatment: 1µL of 30% hydrogen peroxide solution was added (final concentration: 0.3% hydrogen peroxide) to 100 µL of MabThera® (100 mg/10 mL solution), and the solution was left at room temperature for 3 hours. Then, the solution was dialyzed against 10 mM sodium phosphate buffer (6 mM disodium hydrogen phosphate and 4 mM potassium dihydrogen phosphate, pH 7.0) using a dialysis cellulose tube (Visking tubing, manufactured by Serva), and finally diluted 10 times with ultrapure water.
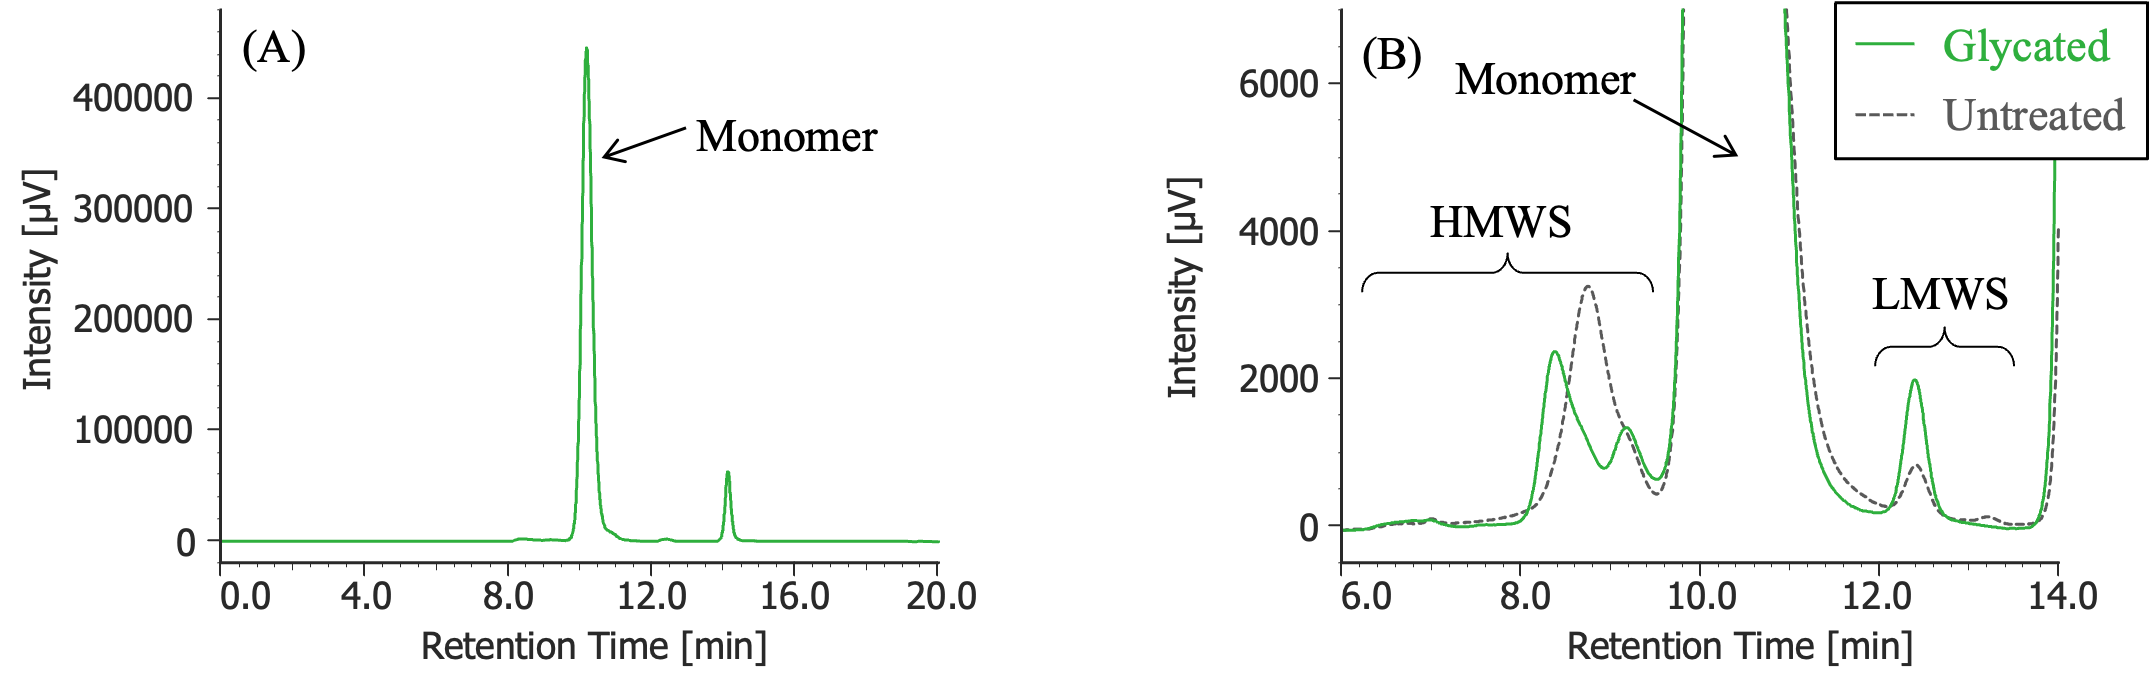
(A) : Full scale, (B) : Enlarged view near the baseline at 6-14 minutes (shown with chromatogram of untreated MabThera®)
Pretreatment: 54 mg of glucose was added to 100 µL of MabThera® (100 mg/10 mL solution) and dissolved (final concentration: 2.5 M glucose), and then left in a constant-temperature oven (SCF-Sro) at 40ºC for 1 week. Then, the solution was dialyzed against 10 mM sodium phosphate buffer (6 mM disodium hydrogen phosphate and 4 mM potassium dihydrogen phosphate, pH 7.0) using a dialysis cellulose tube (Visking tubing, manufactured by Serva), and finally diluted 10 times with ultrapure water.
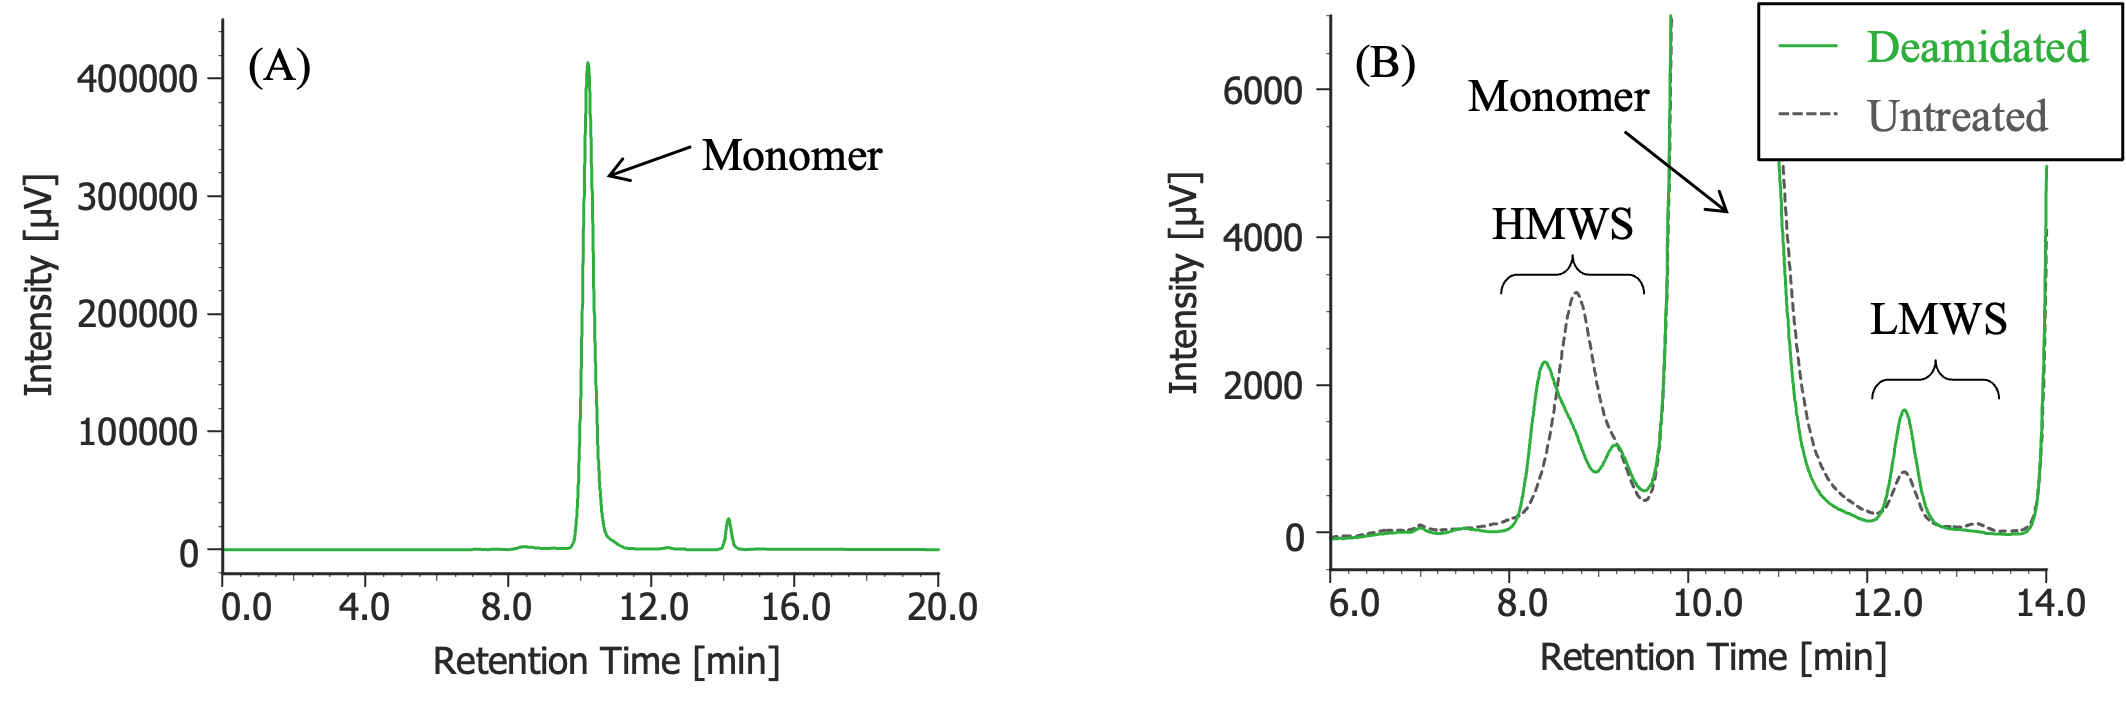
(A) : Full scale, (B) : Enlarged view near the baseline at 6-14 minutes (shown with chromatogram of untreated MabThera®)
Pretreatment: 100 µL of MabThera® (100 mg/10 mL solution) was dialyzed against 10 mM sodium phosphate buffer (6 mM disodium hydrogen phosphate and 4 mM potassium dihydrogen phosphate, pH was adjusted to 8.5 using a 5 M sodium hydroxide solution) using a dialysis cellulose tube (Visking tubing, manufactured by Serva), and then left in a constant-temperature oven (SCF-Sro) at 40ºC for 1 week. Then, the solution was dialyzed against 10 mM sodium phosphate buffer (6 mM disodium hydrogen phosphate and 4 mM potassium dihydrogen phosphate, pH 7.0) again, and finally diluted 10 times with ultrapure water.
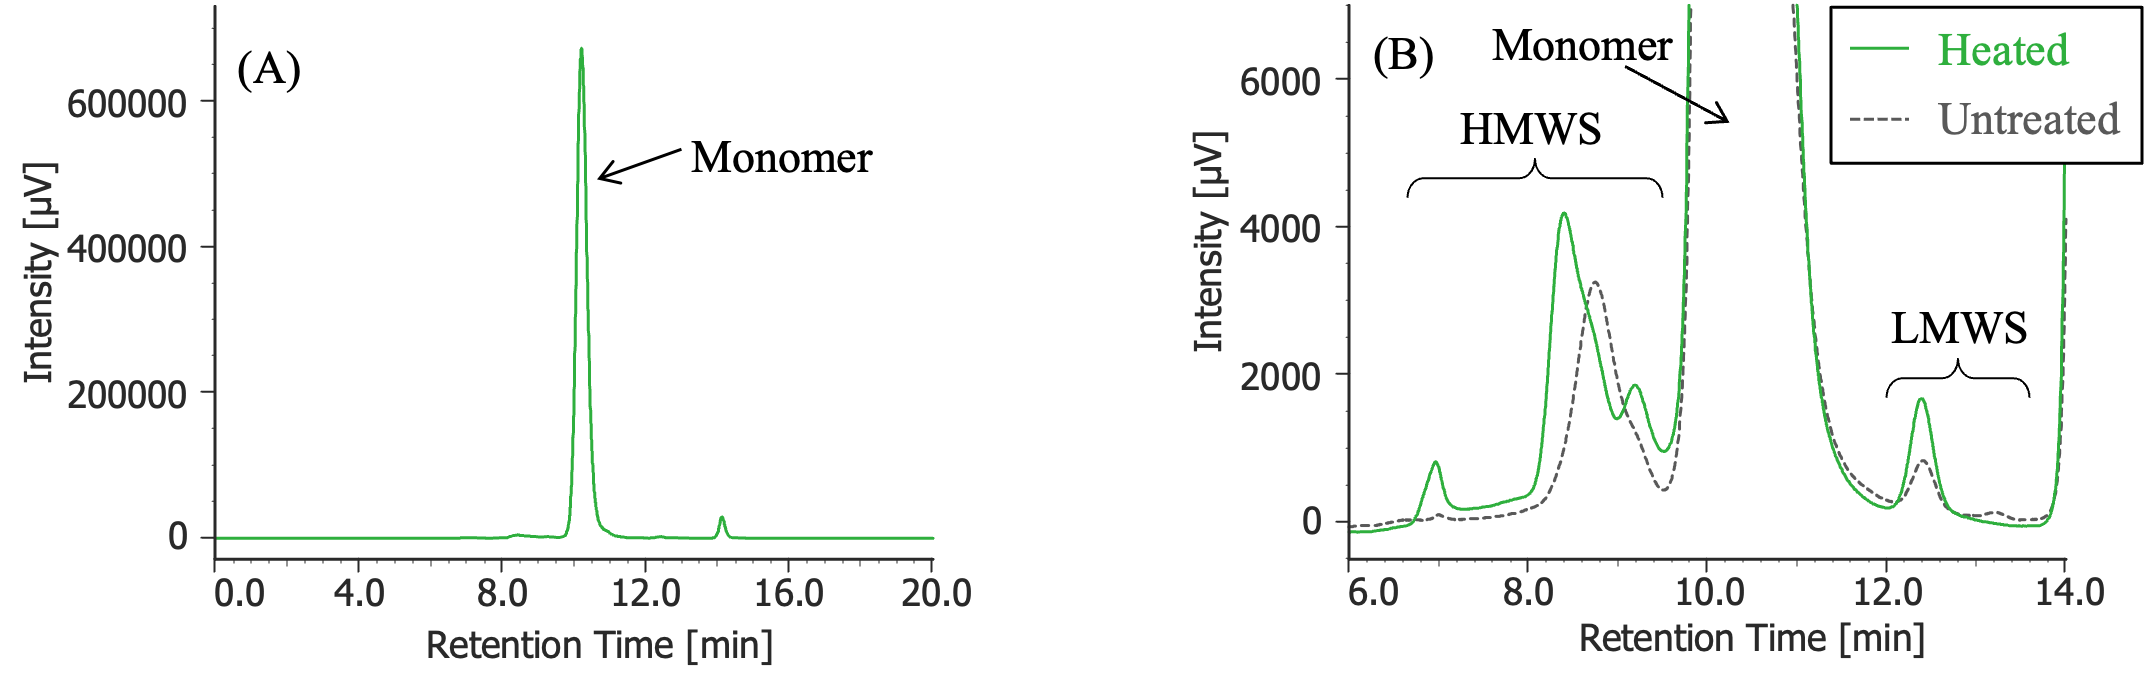
(A) : Full scale, (B) : Enlarged view near the baseline at 6-14 minutes (shown with chromatogram of untreated MabThera®)
Pretreatment: 100 µL of MabThera® (100 mg/10 mL solution) was left in a constant-temperature oven (SCF-Sro) at 40ºC for 8 days and then diluted 10 times with ultrapure water.
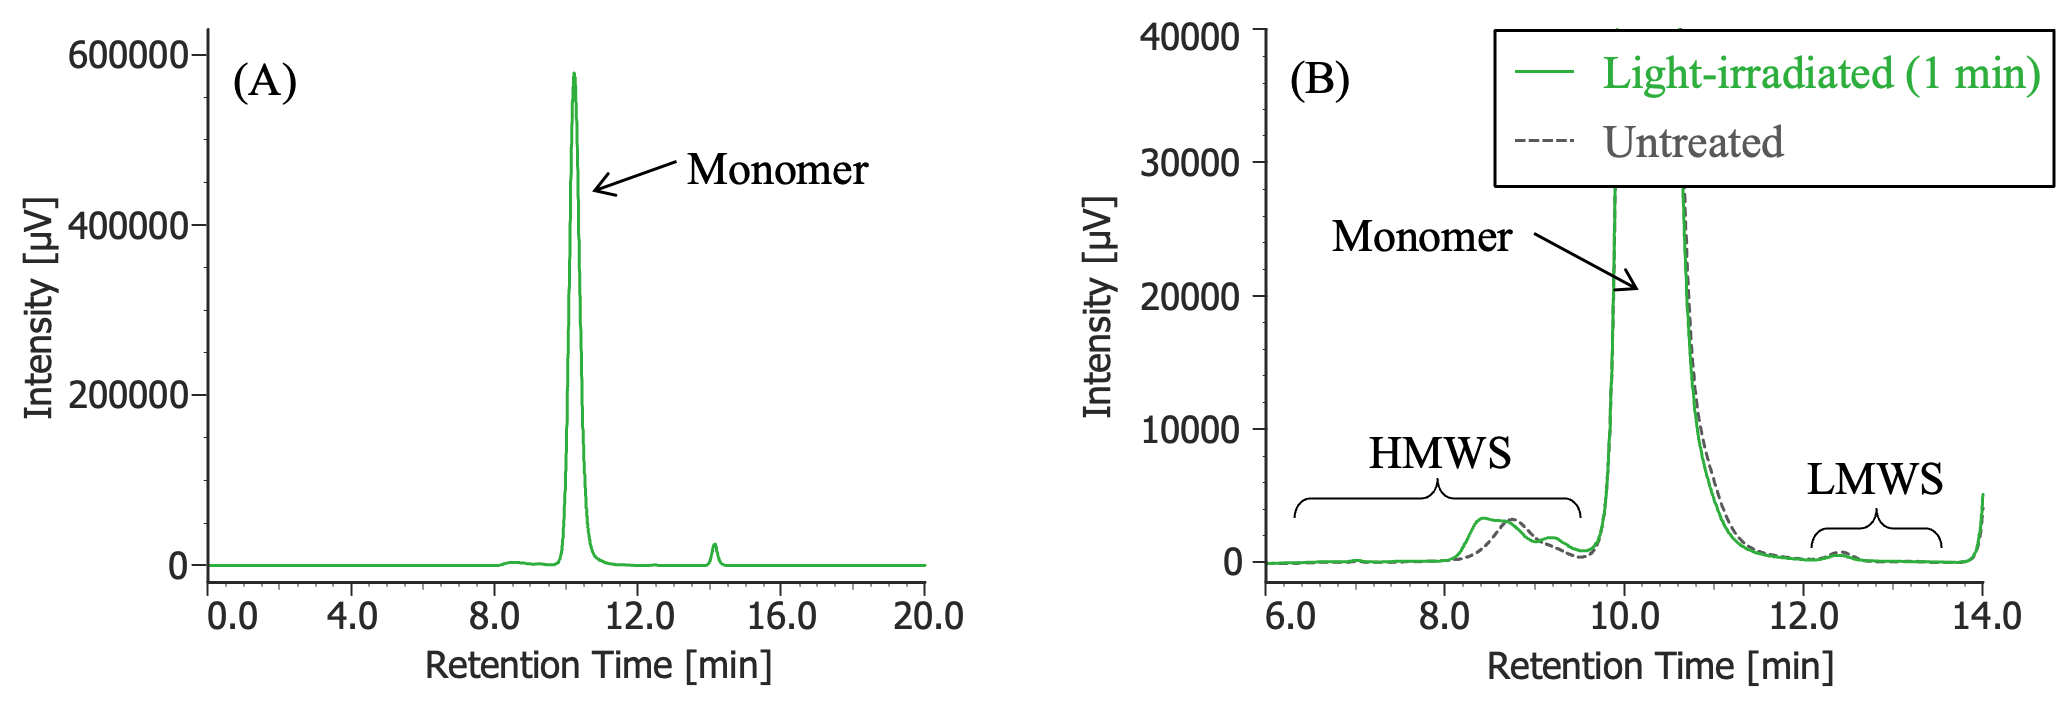
(A) : Full scale, (B) : Enlarged view near the baseline at 6-14 minutes (shown with chromatogram of untreated MabThera®)
Pretreatment: 100 µL of MabThera® (100 mg/10 mL solution) was irradiated with light (energy: 16.3 mW, center wavelength: 247 nm) for 1 minute using a light irradiation system (MM-3, manufactured by Bunkoukeiki).
(A) : Full scale, (B) : Enlarged view near the baseline at 6-14 minutes (shown with chromatogram of untreated MabThera®)
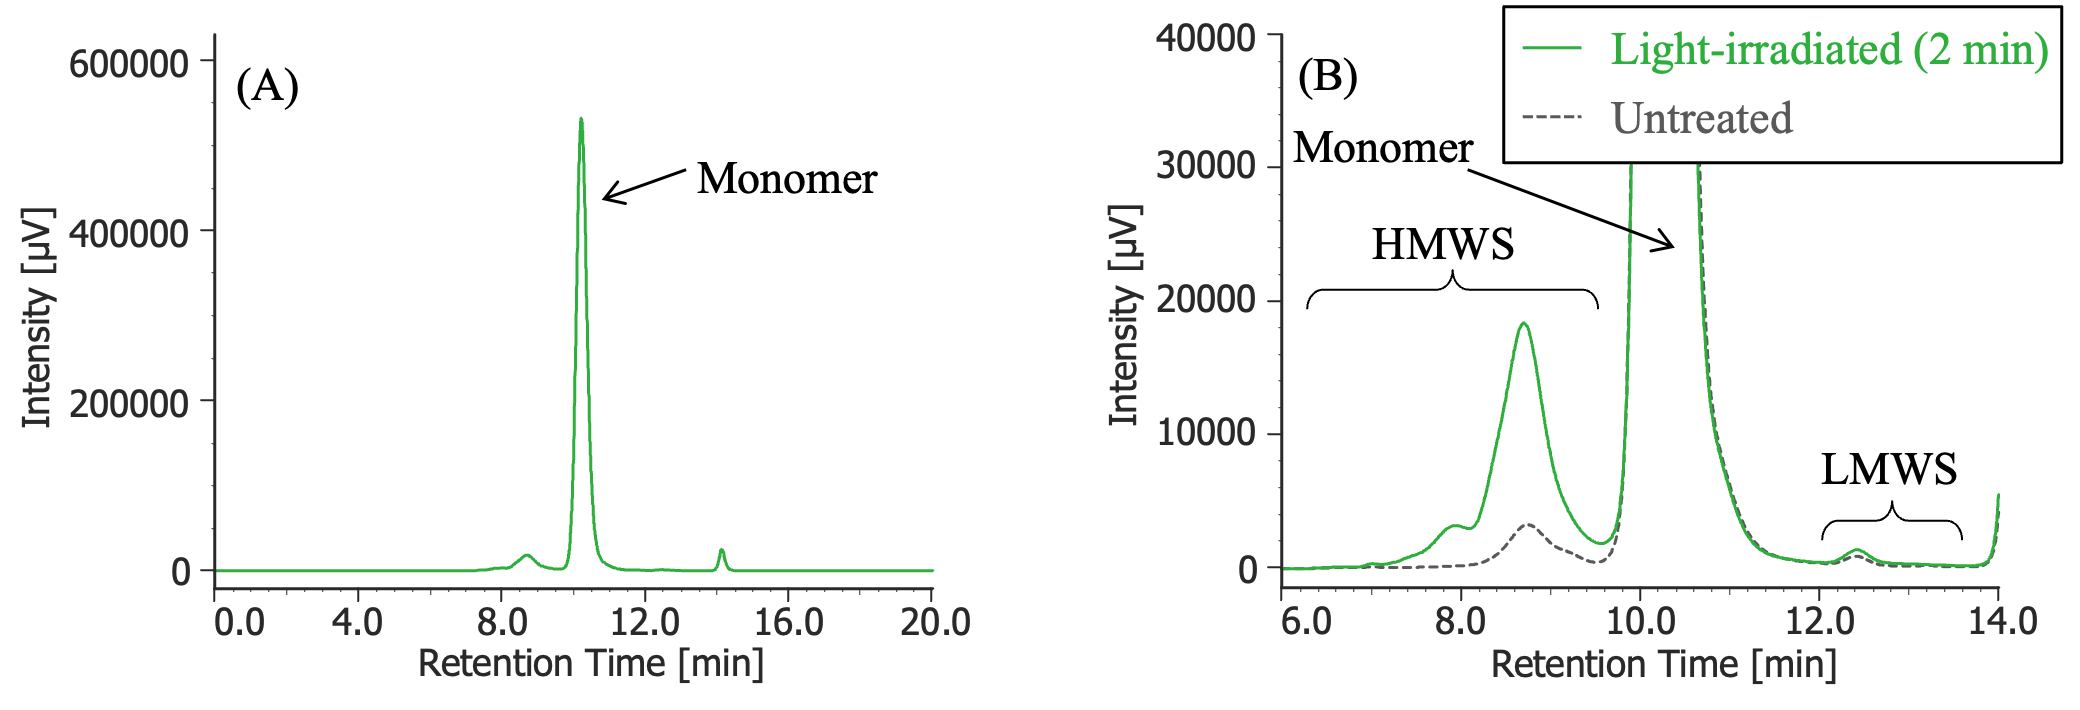
Pretreatment: 100 µL of MabThera® (100 mg/10 mL solution) was irradiated with light (energy: 16.3 mW, center wavelength: 247 nm) for 2 minutes using a light irradiation system (MM-3, manufactured by Bunkoukeiki).
(A) : Full scale, (B) : Enlarged view near the baseline at 6-14 minutes (shown with chromatogram of untreated MabThera®)
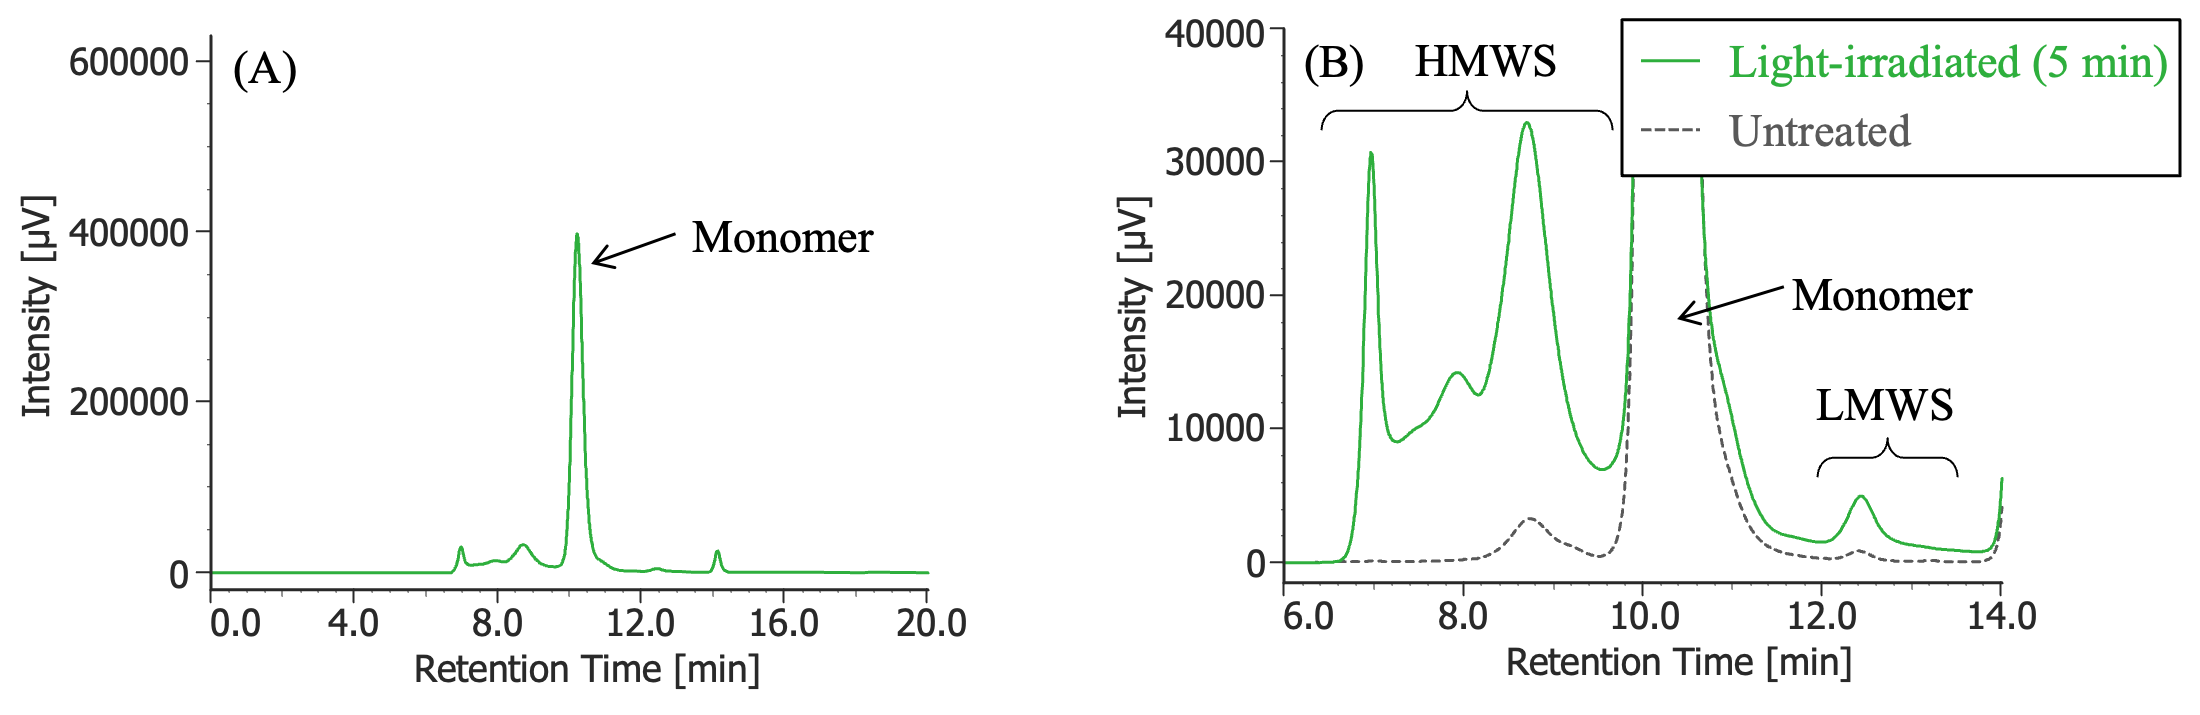
Pretreatment: 100 µL of MabThera® (100 mg/10 mL solution) was irradiated with light (energy: 16.3 mW, center wavelength: 247 nm) for 5 minutes using a light irradiation system (MM-3, manufactured by Bunkoukeiki).
In Figures 3 to 10, the peaks of the chromatograms were categorized into monomer, high molecular weight species (HMWS), including aggregates that elute earlier than the monomer, and low molecular weight species (LMWS), including degradation products that elute after the monomer. Table 1 shows the comparison results of each category ratio (area %) to the total peak area. From these results, the ratio of HWMS of MabThera® that had been oxidized, glycated, deamidated, heated, and light-irradiated (1 minute) increased by about 0.2 – 0.6% and that of LMWS increased by about 0.1 – 0.4% relative to the untreated MabThera®. Regarding light irradiation, it was found that the ratios of the monomer gradually decreased and those of the HMWS and LMWS increased significantly as the irradiation time increased.
Conclusion
In this experiment, it was confirmed that aggregates and degradation products in antibody drugs generated under various FDS test conditions can be well separated from monomers and detected by using SEC.
References
- R. M. Lu, Y. C. Hwang, I. J. Liu, C. C. Lee, H. Z. Tsai, H. J. Li, H. C. Wu, J. Biomed. Sci., 27 (1), 2 (2020). DOI: 10.1186/s12929-019-0592-z
- European Medicines Agency: “ICH Topic Q5C Quality of Biotechnological Products: Stability Testing Biotechnological/Biological Products” <https://www.ema.europa.eu/en/documents/scientific-guideline/ich-topic-q-5-c-quality-biotechnological-products-stability-testing-biotechnological/biological-products_en.pdf>, (accessed 2022. 5. 30).
- European Medicines Agency: “ICH Topic Q1A (R2) Stability Testing of new Drug Substances and Products” < https://www.ema.europa.eu/en/documents/scientific-guideline/ich-q-1-r2-stability-testing-new-drug-substances-products-step-5_en.pdf>, (accessed 2022. 5. 30).
- U.S. Food and Drug Administration: “Guidance for Industry: INDs for Phase 2 and Phase 3 Studies” <https://www.fda.gov/media/70822/download>, (accessed 2022. 5. 30).
- C. Nowak, J. K. Cheung, S. M. Dellatore, A. Katiyar, R. Bhat, J. Sun, G. Ponniah, A. Neill, B. Mason, A. Beck, H. Liu, mAbs, 9 (8), 1217 (2017). DOI: 10.1080/19420862.2017.1368602
- Blessy M, R. D. Patal, P.N. Prajapati, Y. K. Agrawal, J. Pharm. Anal., 4 (3), 159 (2014). DOI: 10.1016/j.jpha.2013.09.003
- J. Halley, Y. R. Chou, C. Cicchino, M. Huang, V. Sharma, N.C. Tan, S. Thakkar, L. L. Zhou, W. A. Azzam, S. Cornen, M. Gauden, Z. Gu, S. Kar, A. C. Lazar, P. Mehndiratta, J. Smith, Z. Sosic, P. Weisbach, E. S. E. Stokes, J. Pharm. Sci., 109, 6 (2020). DOI: 10.1016/j.xphs.2019.09.018
- A. Hawe, M. Wiggenhorn, M. V. D. Weert, J. H. O. Garbe, H.C. Mahler, W. Jiskoot, J. Pharm. Sci., 101 (3), 895 (2012). DOI: 10.1002/jps.22812
Author: LC Technical Solution Group
S. Iijima
Supplemental Information
The pH of the eluent (0.2 mol/L sodium phosphate buffer) becomes approximately 6.7 when 0.1 mol of sodium dihydrogen phosphate and 0.1 mol of disodium hydrogen phosphate are dissolved in 1 L of water.
Water was used as the flush solvent for the autosampler.
The constant-temperature oven (SCF-Sro) used to degrade MabThera® is a custom made JASCO product.

Monitoring of Aggregates and Degradation Products by Size Exclusion Chromatography (SEC) in Forced Degradation Studies of Antibody based Pharmaceuticals
Introduction
Since the first monoclonal antibody (mAb) was approved by the U.S. Food and Drug Administration (FDA) in 1986, the market for therapeutic proteins has expanded rapidly, and antibody drugs have become the predominant treatment modality for a variety of diseases over the past 25 years 1). The stability of a drug molecule is very important because this affects its safety and efficacy. In products with higher order structures, such as antibody-based pharmaceuticals, the maintenance of molecular structure and biological activity depend on non-covalent bonds as well as covalent bonds in the molecule and can be affected by various environmental factors 2).
Contained in the guidelines of the FDA and International Council for Harmonization of Technical Requirements for Pharmaceuticals for Human Use (ICH), is the need for stability test data, which is performed to understand how the quality of drug substances and drug products change over time in different environments 3, 4). Forced Degradation Study (FDS), which purposely deteriorates and degrades the drugs, is required from the early stage of research and development through to marketing approval. FDS is an effective method for elucidating degradation pathways, as well as the structures of molecules formed during the degradation process. Also, it is useful for the development of manufacturing processes, formulation and selection of storage conditions, which includes the type of material required to be used as a container 5, 6). Common test conditions for FDS include heating, freezing and thawing, agitation, pH, light irradiation, oxidation, reduction, and glycation 7, 8). Since one of the degradation pathways that can occur under many of these conditions is aggregation, which are deeply related to immunogenicity, Size Exclusion Chromatography (SEC) is the method of choice for analysis. SEC can efficiently separate and detect monomers and aggregates, including multimers. 5, 7).
In this application note, we performed various FDS on MabThera® (rituximab), which is a therapeutic drug for non-Hodgkin’s lymphoma. Separations were made on untreated as well as forcibly degraded MabThera® by SEC to compare the changes in the amount of monomer and aggregates, including multimers, and degradation products.
Experimental
| Instruments | |
| Pump | PU-4080i* |
| Autosampler | AS-4050i* |
| Column Oven | CO-4060 |
| UV Detector | UV-4075* |
| *with option units | |
| Conditions | |||
| Column | TSKgel G3000SWXL (7.8 mmI.D. x 300 mmL, 5 µm) | Wavelength | 220 nm |
| Eluent | 0.2 mol/L sodium phosphate buffer (pH 6.7) | Injection Volume | 10 µL |
| Flow Rate | 0.8 mL/min | Standard | Protein standard mix 15 to 600 kDa (Merck) 30 mg/mL in water |
| Column Temperature | 25ºC | Sample | MabThera® 100 mg/10 mL (Roche) (Pretreatment methods are described later.) |
Results
1: Thyroglobulin (670 kDa), 2: γ-globulins (150 kDa),
3: Ovalbumin (44.3 kDa), 4: Ribonuclease A (13.7 kDa),
5: p-amino-benzoic acid (0.137 kDa)
Figure 1 shows SEC chromatograms of a blank (ultrapure water) and a protein standard sample using a UV absorbance detector. The column used in this experiment has an exclusion limit for globular proteins of 800 kDa and measurement range of approximately 10 to 500 kDa. As shown in Figure 2, a molecular weight calibration curve was created from the retention times and molecular weights of the four components, except for p-aminobenzoic acid that eluted after the permeation limit (around 13.8 minutes). Based on this calibration curve, the molecular weights of each sample was calculated.
Figure 3 shows the UV chromatogram of MabThera® without degradation treatment. Figures 4 to 7 show UV chromatograms of MabThera® that had been oxidized, glycated, deamidated, and heated, respectively. In addition, Figures 8 to 10 show the UV chromatograms of light-irradiated MabThera® with the irradiation time changed in three steps of 1, 2, and 5 minutes. The peaks around 14 minutes in Figures 3 to 10 are the peaks that eluted after the permeation limit of the column. Although detailed calculation results of molecular weight are not shown here, the monomer peaks were identified from each peak’s top molecular weight in Figures 3 to 10.
(A) : Full scale, (B) : Enlarged view near the baseline at 6-14 minutes (shown with molecular weight calibration curve)
Pretreatment: 100 mg/10 mL of MabThera® was diluted with ultrapure water to 1 mg/mL
(A) : Full scale, (B) : Enlarged view near the baseline at 6-14 minutes (shown with chromatogram of untreated MabThera®
Pretreatment: 1µL of 30% hydrogen peroxide solution was added (final concentration: 0.3% hydrogen peroxide) to 100 µL of MabThera® (100 mg/10 mL solution), and the solution was left at room temperature for 3 hours. Then, the solution was dialyzed against 10 mM sodium phosphate buffer (6 mM disodium hydrogen phosphate and 4 mM potassium dihydrogen phosphate, pH 7.0) using a dialysis cellulose tube (Visking tubing, manufactured by Serva), and finally diluted 10 times with ultrapure water.
(A) : Full scale, (B) : Enlarged view near the baseline at 6-14 minutes (shown with chromatogram of untreated MabThera®)
Pretreatment: 54 mg of glucose was added to 100 µL of MabThera® (100 mg/10 mL solution) and dissolved (final concentration: 2.5 M glucose), and then left in a constant-temperature oven (SCF-Sro) at 40ºC for 1 week. Then, the solution was dialyzed against 10 mM sodium phosphate buffer (6 mM disodium hydrogen phosphate and 4 mM potassium dihydrogen phosphate, pH 7.0) using a dialysis cellulose tube (Visking tubing, manufactured by Serva), and finally diluted 10 times with ultrapure water.
(A) : Full scale, (B) : Enlarged view near the baseline at 6-14 minutes (shown with chromatogram of untreated MabThera®)
Pretreatment: 100 µL of MabThera® (100 mg/10 mL solution) was dialyzed against 10 mM sodium phosphate buffer (6 mM disodium hydrogen phosphate and 4 mM potassium dihydrogen phosphate, pH was adjusted to 8.5 using a 5 M sodium hydroxide solution) using a dialysis cellulose tube (Visking tubing, manufactured by Serva), and then left in a constant-temperature oven (SCF-Sro) at 40ºC for 1 week. Then, the solution was dialyzed against 10 mM sodium phosphate buffer (6 mM disodium hydrogen phosphate and 4 mM potassium dihydrogen phosphate, pH 7.0) again, and finally diluted 10 times with ultrapure water.
(A) : Full scale, (B) : Enlarged view near the baseline at 6-14 minutes (shown with chromatogram of untreated MabThera®)
Pretreatment: 100 µL of MabThera® (100 mg/10 mL solution) was left in a constant-temperature oven (SCF-Sro) at 40ºC for 8 days and then diluted 10 times with ultrapure water.
(A) : Full scale, (B) : Enlarged view near the baseline at 6-14 minutes (shown with chromatogram of untreated MabThera®)
Pretreatment: 100 µL of MabThera® (100 mg/10 mL solution) was irradiated with light (energy: 16.3 mW, center wavelength: 247 nm) for 1 minute using a light irradiation system (MM-3, manufactured by Bunkoukeiki).
(A) : Full scale, (B) : Enlarged view near the baseline at 6-14 minutes (shown with chromatogram of untreated MabThera®)
Pretreatment: 100 µL of MabThera® (100 mg/10 mL solution) was irradiated with light (energy: 16.3 mW, center wavelength: 247 nm) for 2 minutes using a light irradiation system (MM-3, manufactured by Bunkoukeiki).
(A) : Full scale, (B) : Enlarged view near the baseline at 6-14 minutes (shown with chromatogram of untreated MabThera®)
Pretreatment: 100 µL of MabThera® (100 mg/10 mL solution) was irradiated with light (energy: 16.3 mW, center wavelength: 247 nm) for 5 minutes using a light irradiation system (MM-3, manufactured by Bunkoukeiki).
In Figures 3 to 10, the peaks of the chromatograms were categorized into monomer, high molecular weight species (HMWS), including aggregates that elute earlier than the monomer, and low molecular weight species (LMWS), including degradation products that elute after the monomer. Table 1 shows the comparison results of each category ratio (area %) to the total peak area. From these results, the ratio of HWMS of MabThera® that had been oxidized, glycated, deamidated, heated, and light-irradiated (1 minute) increased by about 0.2 – 0.6% and that of LMWS increased by about 0.1 – 0.4% relative to the untreated MabThera®. Regarding light irradiation, it was found that the ratios of the monomer gradually decreased and those of the HMWS and LMWS increased significantly as the irradiation time increased.
Conclusion
In this experiment, it was confirmed that aggregates and degradation products in antibody drugs generated under various FDS test conditions can be well separated from monomers and detected by using SEC.
Keywords
biopharmaceutical, antibody drug, FDS, aggregate, protein degradation product, MabThera®, TSKgel G3000SWXL, SEC, UV detector, protein aggregation
References
- R. M. Lu, Y. C. Hwang, I. J. Liu, C. C. Lee, H. Z. Tsai, H. J. Li, H. C. Wu, J. Biomed. Sci., 27 (1), 2 (2020). DOI: 10.1186/s12929-019-0592-z
- European Medicines Agency: “ICH Topic Q5C Quality of Biotechnological Products: Stability Testing Biotechnological/Biological Products” <https://www.ema.europa.eu/en/documents/scientific-guideline/ich-topic-q-5-c-quality-biotechnological-products-stability-testing-biotechnological/biological-products_en.pdf>, (accessed 2022. 5. 30).
- European Medicines Agency: “ICH Topic Q1A (R2) Stability Testing of new Drug Substances and Products” < https://www.ema.europa.eu/en/documents/scientific-guideline/ich-q-1-r2-stability-testing-new-drug-substances-products-step-5_en.pdf>, (accessed 2022. 5. 30).
- U.S. Food and Drug Administration: “Guidance for Industry: INDs for Phase 2 and Phase 3 Studies” <https://www.fda.gov/media/70822/download>, (accessed 2022. 5. 30).
- C. Nowak, J. K. Cheung, S. M. Dellatore, A. Katiyar, R. Bhat, J. Sun, G. Ponniah, A. Neill, B. Mason, A. Beck, H. Liu, mAbs, 9 (8), 1217 (2017). DOI: 10.1080/19420862.2017.1368602
- Blessy M, R. D. Patal, P.N. Prajapati, Y. K. Agrawal, J. Pharm. Anal., 4 (3), 159 (2014). DOI: 10.1016/j.jpha.2013.09.003
- J. Halley, Y. R. Chou, C. Cicchino, M. Huang, V. Sharma, N.C. Tan, S. Thakkar, L. L. Zhou, W. A. Azzam, S. Cornen, M. Gauden, Z. Gu, S. Kar, A. C. Lazar, P. Mehndiratta, J. Smith, Z. Sosic, P. Weisbach, E. S. E. Stokes, J. Pharm. Sci., 109, 6 (2020). DOI: 10.1016/j.xphs.2019.09.018
- A. Hawe, M. Wiggenhorn, M. V. D. Weert, J. H. O. Garbe, H.C. Mahler, W. Jiskoot, J. Pharm. Sci., 101 (3), 895 (2012). DOI: 10.1002/jps.22812
Author: LC Technical Solution Group
S. Iijima
Supplemental Information
The pH of the eluent (0.2 mol/L sodium phosphate buffer) becomes approximately 6.7 when 0.1 mol of sodium dihydrogen phosphate and 0.1 mol of disodium hydrogen phosphate are dissolved in 1 L of water.
Water was used as the flush solvent for the autosampler.
The constant-temperature oven (SCF-Sro) used to degrade MabThera® is a custom made JASCO product.