Preparative SFC/SFE with Switching System and MS Detector
August 15, 2022
Introduction
A mass spectrometer not only provides mass information that is crucial for purification chemists but also delivers increased sensitivity and selectivity relative to conventional chromatography detectors. In recent years it has been used as the method of selective detection for target analytes and identification of impurities in the development of pharmaceuticals and in a variety of other industries.
Supercritical fluid extraction (SFE) enables fast and efficient extraction using a supercritical fluid that has the specific characteristics of high diffusivity, permeability, and solubility. SFE with supercritical CO2 has advantages of easy post extraction handling, lower solvent costs, and automation by device control.
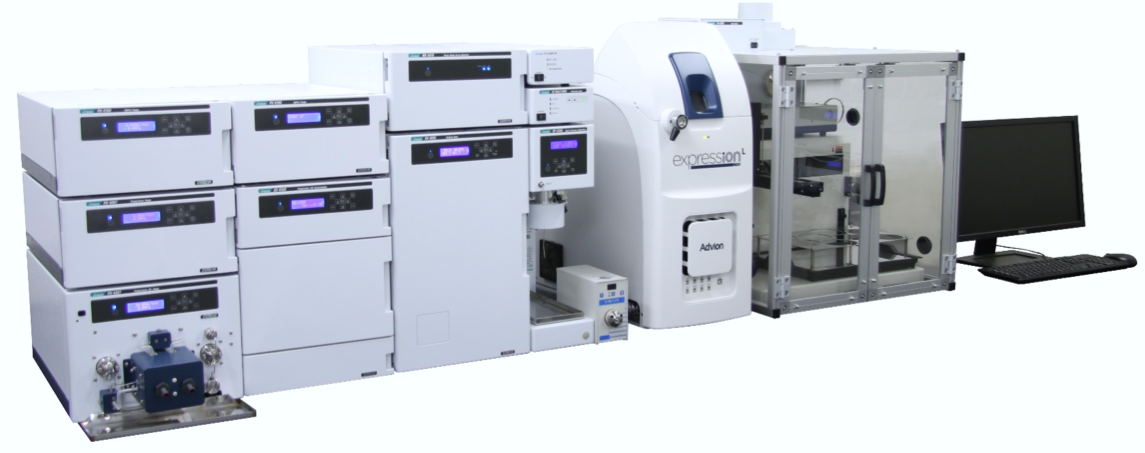
We developed a switching system that has both SFE and Preparative SFC/MS capabilities. This presentation outlines the extraction of caffeine from coffee beans and the subsequent purification and re-analysis of the fractions.
Experimental
Apparatus
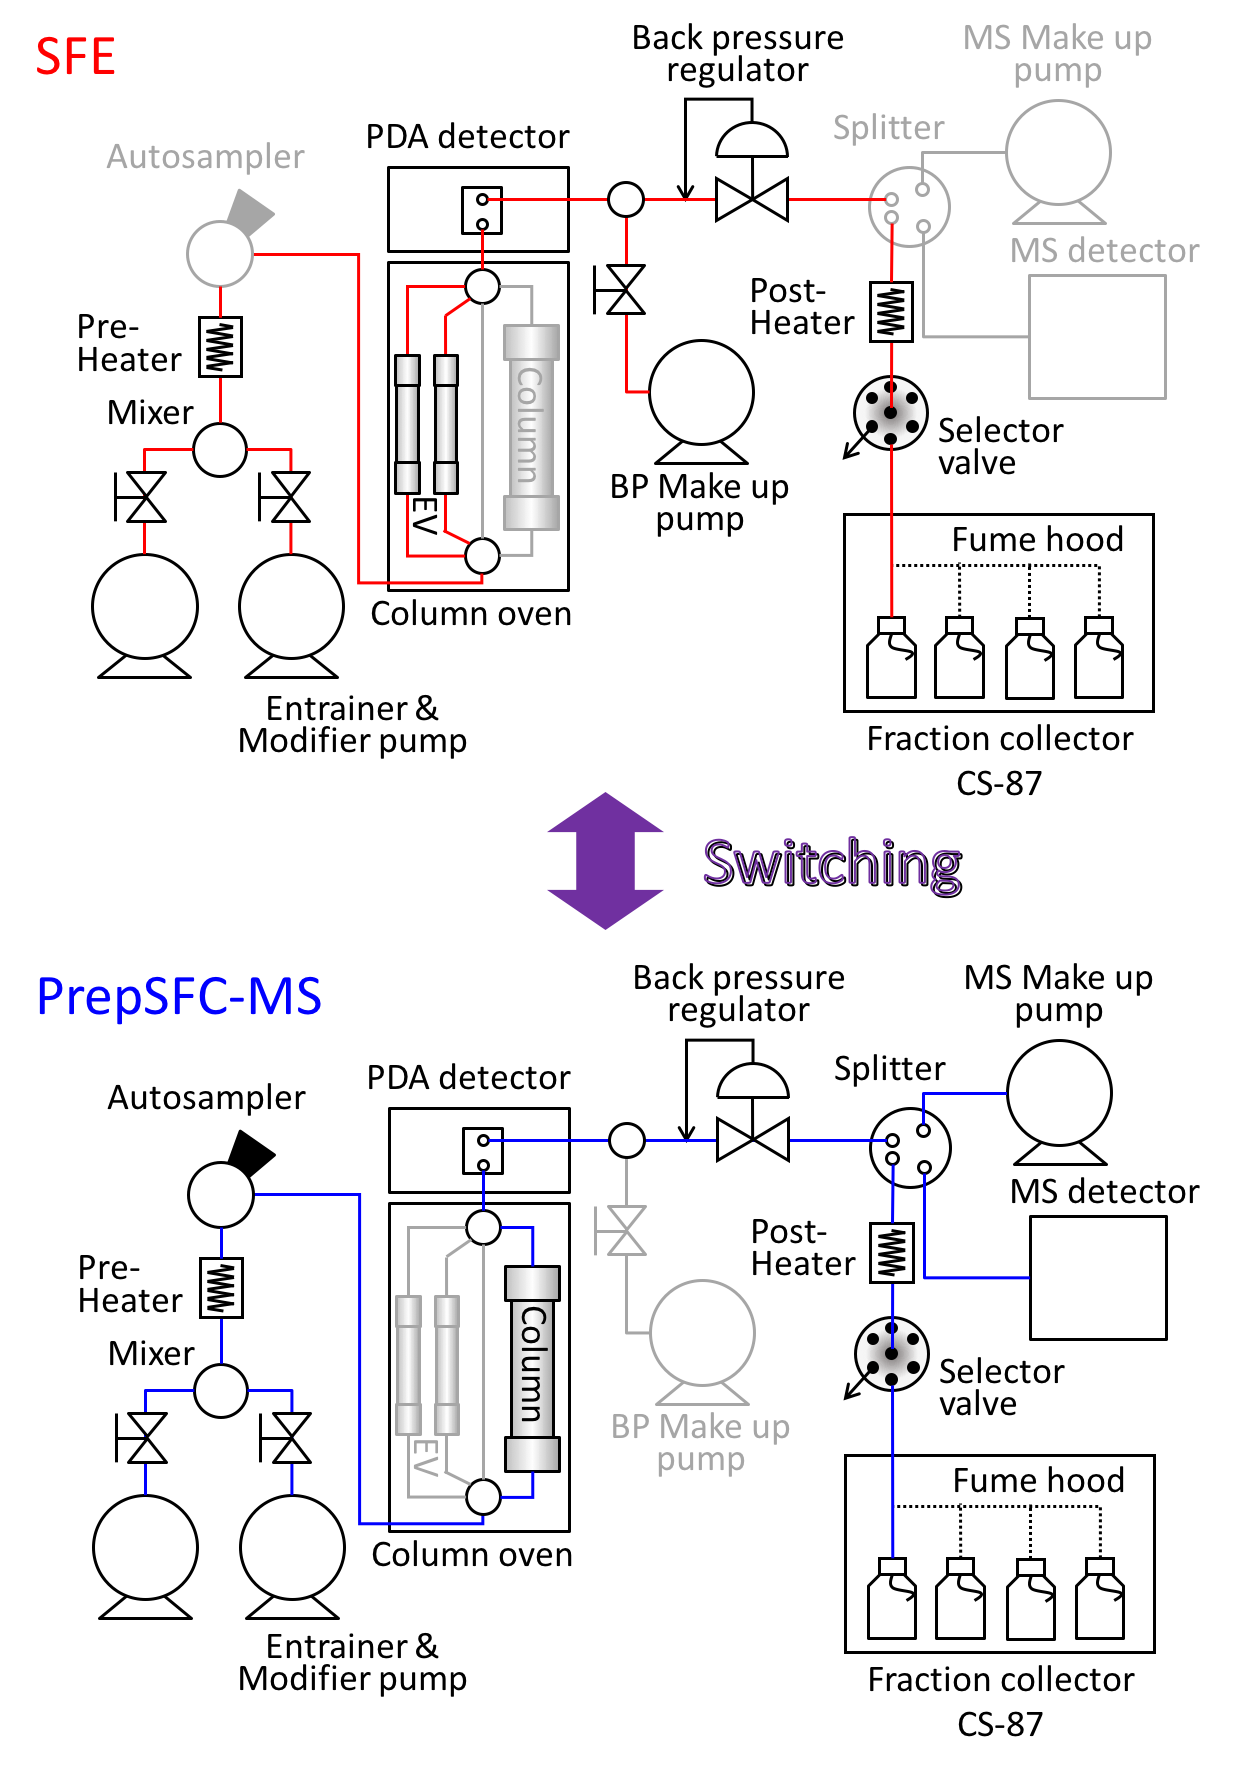
Figure 2 shows the JASCO switching system of SFE/Prep SFC with MS detector used in this experiment. Figure 2 also shows a schematic diagram of this system. The column oven equipped with 10 position-11 port valves enables the switching of several extraction vessels, analytical scale columns, and semi-prep scale columns without re-plumbing.
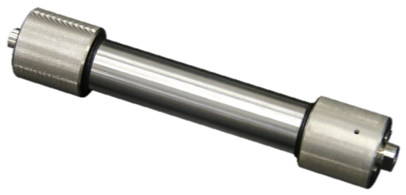
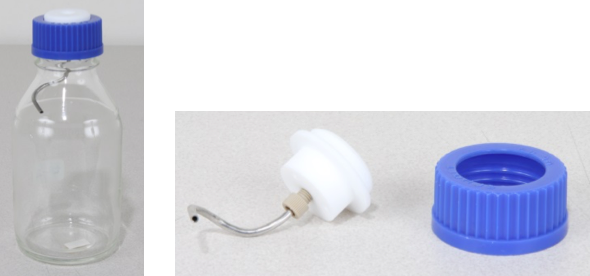
Figure 3 shows the cyclone separator (CS-87) used on the open-bed fraction collector. It significantly increases the fraction recovery. Figure 4 shows the extraction vessel (EV-2) used for SFE.
Conditions for SFE and Prep SFC-MS
The SFE procedure was performed by PEEM (Programmed Extraction Elution Method) that enhances extraction efficiency and selectivity with changing the flow rate of an entrainer and back pressure in stages. We used mixtures of methanol/water and ethanol/water as entrainers.
In Prep SFC, we used a silica column (20 mmI.D.), and the separation was performed by gradient elution of CO2 and methanol at 30 mL/min total flow rate. The MS detector ion source was ESI-positive, and measurement mode was selected ion monitoring (SIM) at 195.2 m/z.
Sample Preparation
Procedure of sample pretreatment of green coffee beans:
Green coffee beans
↓
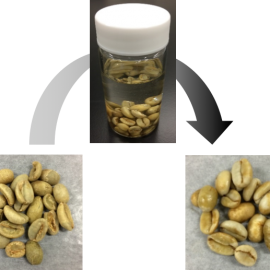
Soak them in water at room temperature overnight in order to extract caffeine efficiently (Fig. 5).
↓
Take them out of water, and wipe with laboratory tissue paper.
↓
Load 4g of this sample into an extraction vessel.
Results
SFE
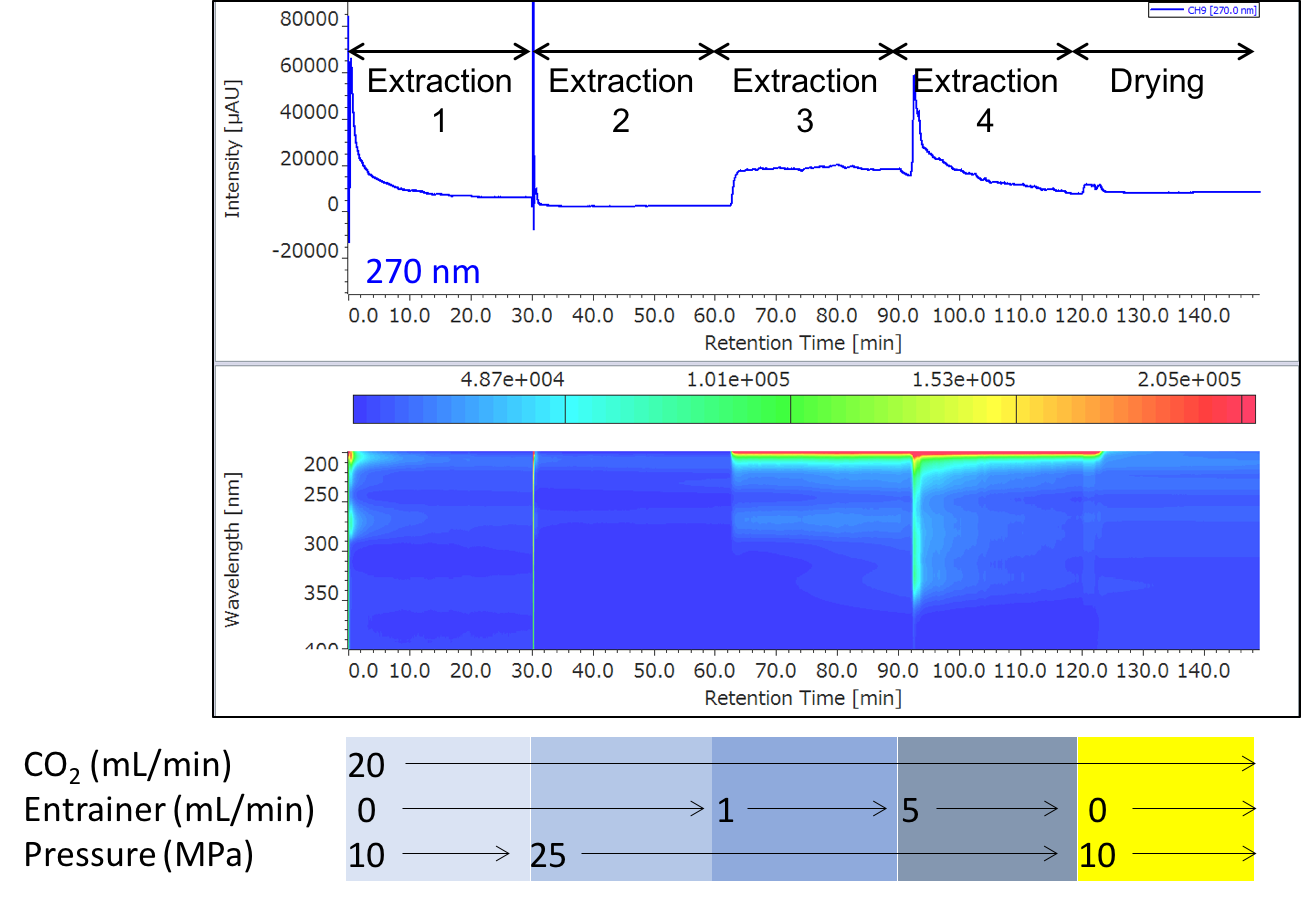
Figure 6 shows the extraction result of sample 1. The extracts were collected in 4 vials at each extraction step (extraction 1 to 4). Table 1 shows the loading of green coffee beans into vessels, the composition of entrainers, and the collection volumes.
Table 1 Sample Loading, Entrainer Composition and Fraction Volume
| Sample No. | 1 | 2 |
| Sample (wet g) | 4.09 | 4.07 |
| Sample (dry g) | 2.18 | 2.17 |
| Entrainer | Methanol/Water (39/1) | Ethanol/Water (39/1) |
| Collection Volume (mL) | ||
| Extraction 1 | 27 | 35.5 |
| Extraction 2 | 39 | 37.5 |
| Extraction 3 | 66 | 67.5 |
| Extraction 4 | 178 | 184 |
Prep SFC-MS
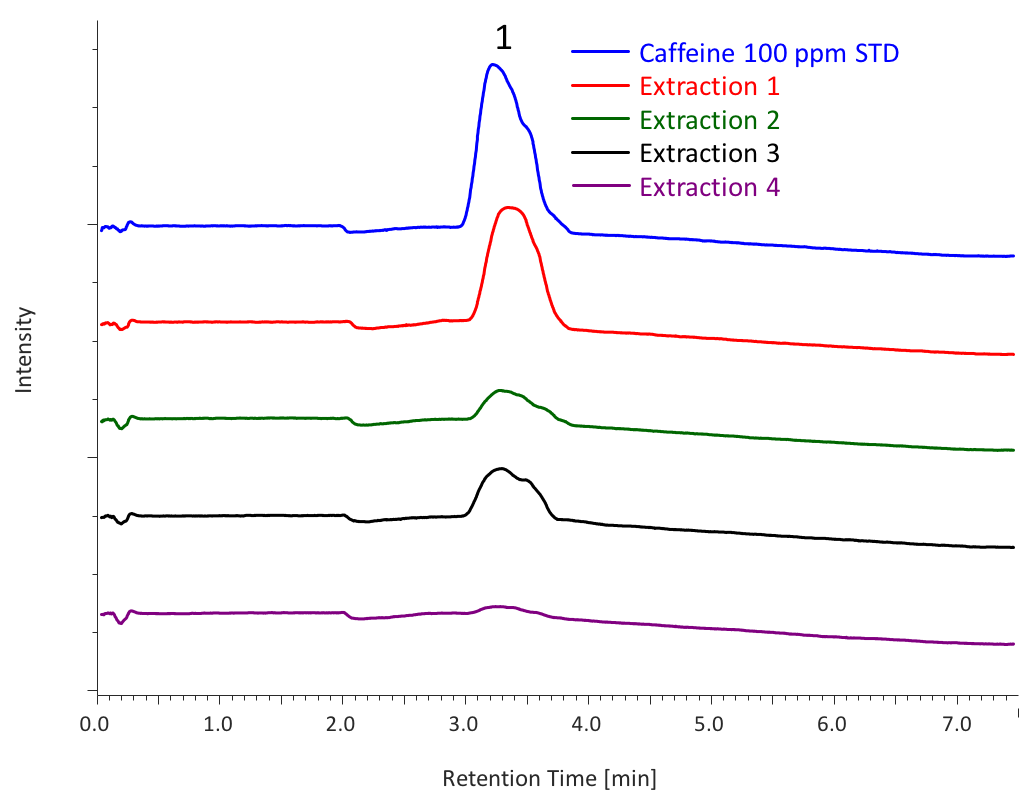
Figure 7 shows the chromatograms of each extraction (1 to 4) from sample 1. Table 2 shows the total extraction amount in each extraction, calculated from the peak area of caffeine standard solution (100 ppm, 500 µL). As shown in this table, high extraction efficiency was achieved for sample 1 using a mixture of methanol and water as an entrainer.
Table 2 Extraction Amount
| Caffeine STD | |||||
| Concentration (µg/mL) | 100 | ||||
| Injection Volume (mL) | 0.5 | ||||
| Injection Amount (µg) | 50 | ||||
| Peak Area (µV • sec) | 406959 | ||||
| Extraction No. | Extraction Amount per Coffee Beans 2.18 g (µg) 5583 |
||||
| Sample 1 | 1 | 2 | 3 | 4 | |
| Peak Area (µV • sec) | 293049 | 80299 | 127776 | 18218 | |
| Amount per 1 Injection (µg/0.5 mL) | 36.0 | 9.9 | 15.7 | 2.2 | |
| Collection Volume (mL) | 27 | 39 | 66 | 178 | |
| Total Extraction Amount (µg) | 1944 | 770 | 2072 | 797 | |
| Extraction No. | Extraction Amount per Coffee Beans 2.17 g (µg) 2663 |
||||
| Sample 2 | 1 | 2 | 3 | 4 | |
| Peak Area (µV • sec) | 131308 | 34067 | 34800 | 13295 | |
| Amount per 1 Injection (µg/0.5 mL) | 16.3 | 4.2 | 4.3 | 1.7 | |
| Collection Volume (mL) | 35.5 | 37.5 | 67.5 | 184 | |
| Total Extraction Amount (µg) | 1156 | 317 | 583 | 607 | |
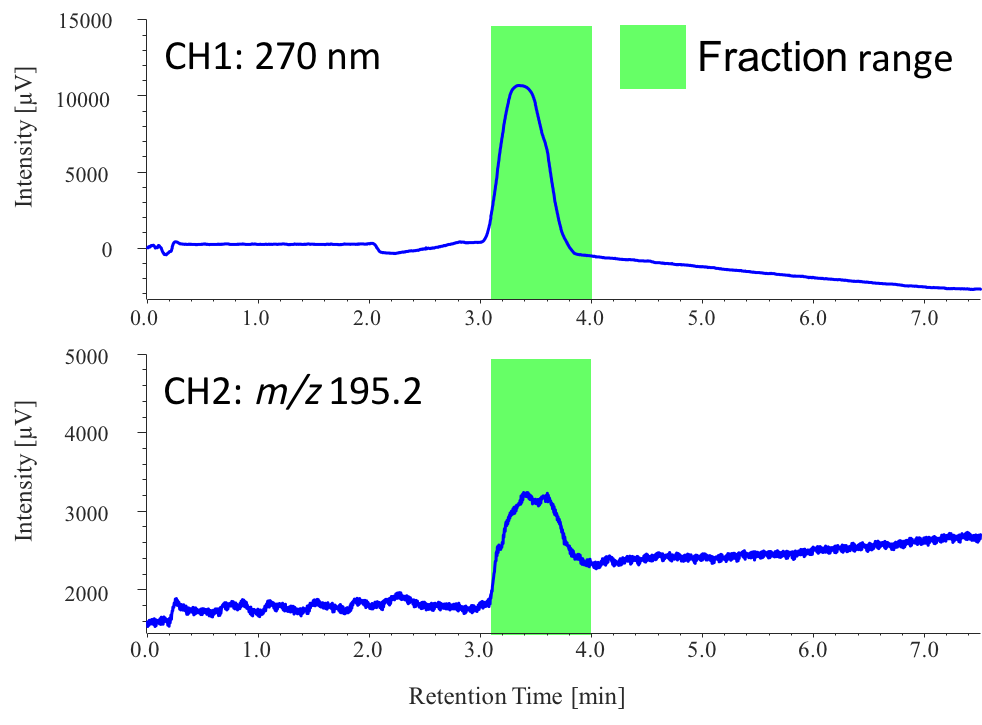
Figure 8 shows the collection results of the caffeine peak in extraction 1 from sample 1, triggered based on the MS signal (CH1: 270 nm, CH2: m/z 195.2). MS triggering is effective for the fraction collection of non-chromophoric compounds. ChromNAV with fraction collector management program (chromatography software) supports automatic fractions with advanced fraction algorithms for peak collection, using time, threshold, and slope, and can also be programmed to use signals simultaneously from multiple detectors.
Purity Determination of Extracts by HPLC-PDA
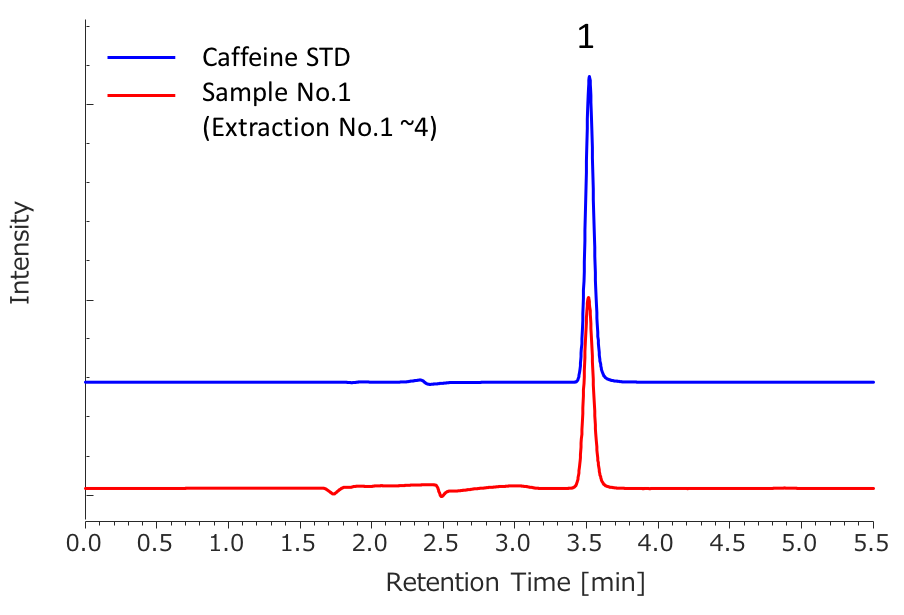
Peak 1: Caffeine
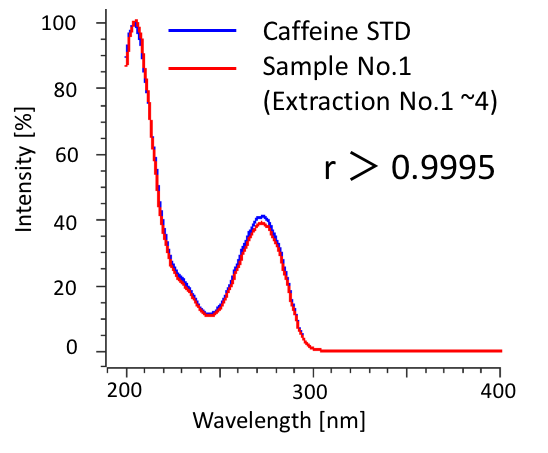
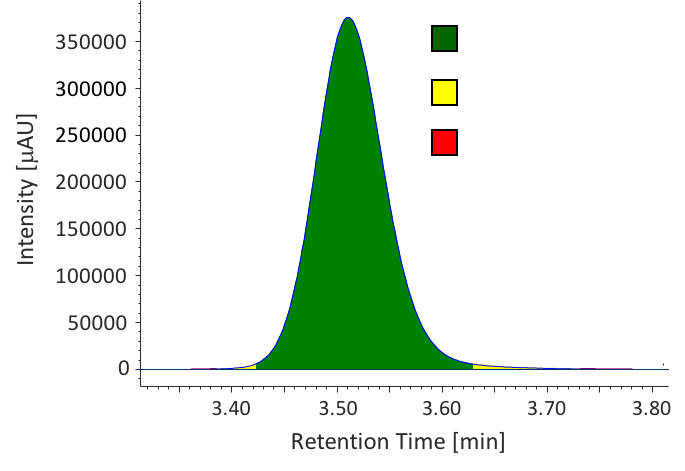
We determined the purity of extracts collected in SFE by HPLC-PDA. Figure 9 shows the chromatograms of caffeine standard solution and concentrated extracts (mixture of extraction 1 to 4) from sample 1. Figure 10 shows the comparison of caffeine spectra between standard solution and sample solution. A high correlation coefficient was obtained between them (> 0.9995). Figure 11 and Table 3 show the results of peak purity. 98.8% of the peak was determined high-purity caffeine.
| System | Conditions | ||
| Pump | PU-4180 | Column | InertSustain C18 (4.6 mmI.D. x 150 mmL, 3 μm) |
| Pump Option | LPG Unit, DG Unit | Eluent | CH3CN/H2O (20/80) |
| Autosampler | AS-4150 | Flow Rate | 0.9 mL/min |
| Column Oven | CO-4060 | Column Temp | 40 ˚C |
| Detector | MD-4010 | Wavelength | 274 nm |
| Injection Volume | 10 μL |
||
Sample Preparation
Evaporate the extracts (extraction 1 to 4) from sample 1 to dryness.
↓
Dissolve in 3 mL of methanol.
↓
Inject to HPLC.
Table 3 Peak Purity
Conclusion
- We achieved the extraction and fraction collection of caffeine from green coffee beans using a switching system SFE/Prep SFC-MS.
- The combination of PDA and MS detectors enables the detection and fraction collection of various compounds with or without a chromophore.
- ChromNAV software provides automatic and accurate fractions with advanced fraction algorithms, and useful functions (ex. fraction simulation, graphical display of collection monitoring and results).
References
Presented at SFC 2017 Rockville, MD
Akitaka Tearada1, Satoe Iijima1, DJ Tognarelli2, John Burchell2, Yasuyo Sato1, Miki Kuwajima1
1JASCO Corporation, 2967-5 Ishikawa-machi, Hachioji, Tokyo 192-8537
2JASCO Incorporated, 28600 Mary’s Court, Easton, MD 21601
E-mail: [email protected]
Featured Products:

Preparative SFC/SFE with Switching System and MS Detector
Introduction

A mass spectrometer not only provides mass information that is crucial for purification chemists but also delivers increased sensitivity and selectivity relative to conventional chromatography detectors. In recent years it has been used as the method of selective detection for target analytes and identification of impurities in the development of pharmaceuticals and in a variety of other industries.
Supercritical fluid extraction (SFE) enables fast and efficient extraction using a supercritical fluid that has the specific characteristics of high diffusivity, permeability, and solubility. SFE with supercritical CO2 has advantages of easy post extraction handling, lower solvent costs, and automation by device control.
We developed a switching system that has both SFE and Preparative SFC/MS capabilities. This presentation outlines the extraction of caffeine from coffee beans and the subsequent purification and re-analysis of the fractions.
Experimental
Apparatus

Figure 2 shows the JASCO switching system of SFE/Prep SFC with MS detector used in this experiment. Figure 2 also shows a schematic diagram of this system. The column oven equipped with 10 position-11 port valves enables the switching of several extraction vessels, analytical scale columns, and semi-prep scale columns without re-plumbing.
Figure 3 shows the cyclone separator (CS-87) used on the open-bed fraction collector. It significantly increases the fraction recovery. Figure 4 shows the extraction vessel (EV-2) used for SFE.


Conditions for SFE and Prep SFC-MS
The SFE procedure was performed by PEEM (Programmed Extraction Elution Method) that enhances extraction efficiency and selectivity with changing the flow rate of an entrainer and back pressure in stages. We used mixtures of methanol/water and ethanol/water as entrainers.
In Prep SFC, we used a silica column (20 mmI.D.), and the separation was performed by gradient elution of CO2 and methanol at 30 mL/min total flow rate. The MS detector ion source was ESI-positive, and measurement mode was selected ion monitoring (SIM) at 195.2 m/z.
Sample Preparation

Procedure of sample pretreatment of green coffee beans:
Green coffee beans
↓
Soak them in water at room temperature overnight in order to extract caffeine efficiently (Fig. 5).
↓
Take them out of water, and wipe with laboratory tissue paper.
↓
Load 4g of this sample into an extraction vessel.
Results
SFE

Figure 6 shows the extraction result of sample 1. The extracts were collected in 4 vials at each extraction step (extraction 1 to 4). Table 1 shows the loading of green coffee beans into vessels, the composition of entrainers, and the collection volumes.
Table 1 Sample Loading, Entrainer Composition and Fraction Volume
| Sample No. | 1 | 2 |
| Sample (wet g) | 4.09 | 4.07 |
| Sample (dry g) | 2.18 | 2.17 |
| Entrainer | Methanol/Water (39/1) | Ethanol/Water (39/1) |
| Collection Volume (mL) | ||
| Extraction 1 | 27 | 35.5 |
| Extraction 2 | 39 | 37.5 |
| Extraction 3 | 66 | 67.5 |
| Extraction 4 | 178 | 184 |
Prep SFC-MS

Figure 7 shows the chromatograms of each extraction (1 to 4) from sample 1. Table 2 shows the total extraction amount in each extraction, calculated from the peak area of caffeine standard solution (100 ppm, 500 µL). As shown in this table, high extraction efficiency was achieved for sample 1 using a mixture of methanol and water as an entrainer.
Table 2 Extraction Amount
| Caffeine STD | |||||
| Concentration (µg/mL) | 100 | ||||
| Injection Volume (mL) | 0.5 | ||||
| Injection Amount (µg) | 50 | ||||
| Peak Area (µV • sec) | 406959 | ||||
| Extraction No. | Extraction Amount per Coffee Beans 2.18 g (µg) 5583 |
||||
| Sample 1 | 1 | 2 | 3 | 4 | |
| Peak Area (µV • sec) | 293049 | 80299 | 127776 | 18218 | |
| Amount per 1 Injection (µg/0.5 mL) | 36.0 | 9.9 | 15.7 | 2.2 | |
| Collection Volume (mL) | 27 | 39 | 66 | 178 | |
| Total Extraction Amount (µg) | 1944 | 770 | 2072 | 797 | |
| Extraction No. | Extraction Amount per Coffee Beans 2.17 g (µg) 2663 |
||||
| Sample 2 | 1 | 2 | 3 | 4 | |
| Peak Area (µV • sec) | 131308 | 34067 | 34800 | 13295 | |
| Amount per 1 Injection (µg/0.5 mL) | 16.3 | 4.2 | 4.3 | 1.7 | |
| Collection Volume (mL) | 35.5 | 37.5 | 67.5 | 184 | |
| Total Extraction Amount (µg) | 1156 | 317 | 583 | 607 | |

Figure 8 shows the collection results of the caffeine peak in extraction 1 from sample 1, triggered based on the MS signal (CH1: 270 nm, CH2: m/z 195.2). MS triggering is effective for the fraction collection of non-chromophoric compounds. ChromNAV with fraction collector management program (chromatography software) supports automatic fractions with advanced fraction algorithms for peak collection, using time, threshold, and slope, and can also be programmed to use signals simultaneously from multiple detectors.
Purity Determination of Extracts by HPLC-PDA

Peak 1: Caffeine
We determined the purity of extracts collected in SFE by HPLC-PDA. Figure 9 shows the chromatograms of caffeine standard solution and concentrated extracts (mixture of extraction 1 to 4) from sample 1. Figure 10 shows the comparison of caffeine spectra between standard solution and sample solution. A high correlation coefficient was obtained between them (> 0.9995). Figure 11 and Table 3 show the results of peak purity. 98.8% of the peak was determined high-purity caffeine.
| System | Conditions | ||
| Pump | PU-4180 | Column | InertSustain C18 (4.6 mmI.D. x 150 mmL, 3 μm) |
| Pump Option | LPG Unit, DG Unit | Eluent | CH3CN/H2O (20/80) |
| Autosampler | AS-4150 | Flow Rate | 0.9 mL/min |
| Column Oven | CO-4060 | Column Temp | 40 ˚C |
| Detector | MD-4010 | Wavelength | 274 nm |
| Injection Volume | 10 μL |
||

Sample Preparation

Evaporate the extracts (extraction 1 to 4) from sample 1 to dryness.
↓
Dissolve in 3 mL of methanol.
↓
Inject to HPLC.
Table 3 Peak Purity
Conclusion
- We achieved the extraction and fraction collection of caffeine from green coffee beans using a switching system SFE/Prep SFC-MS.
- The combination of PDA and MS detectors enables the detection and fraction collection of various compounds with or without a chromophore.
- ChromNAV software provides automatic and accurate fractions with advanced fraction algorithms, and useful functions (ex. fraction simulation, graphical display of collection monitoring and results).
References
Presented at SFC 2017 Rockville, MD
Akitaka Tearada1, Satoe Iijima1, DJ Tognarelli2, John Burchell2, Yasuyo Sato1, Miki Kuwajima1
1JASCO Corporation, 2967-5 Ishikawa-machi, Hachioji, Tokyo 192-8537
2JASCO Incorporated, 28600 Mary’s Court, Easton, MD 21601
E-mail: [email protected]

 Download This Application
