Purification of Parthenolide in Feverfew by SFE & SFC with Evaporative Light Scattering Detection
May 3, 2024
 Download This Application
Introduction
An evaporative light scattering detector (ELSD) can be used for the detection of a wide variety of compounds including those that do not have any specific properties such as UV absorption with the exception for volatile compounds. When ELSD is used in supercritical fluid chromatography (SFC), the detection parameters in ELSD should be optimized because the chromatogram shows specific behavior in SFC. In this presentation we measured the behavior of the chromatogram by changing those parameters.
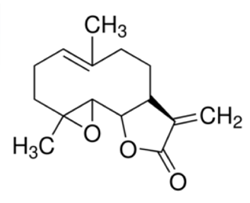
Fever few (Tanacetumparthenium, Figure 1) is a medicinal herb and contains sesquiterpene lactone [Parthenolide (Figure 2) is reported to be active principle]. In this presentation, we tried to purify Parthenolide in feverfew by Supercritical fluid extraction (SFE) and the subsequent SFC with ELS detection.

Experimental
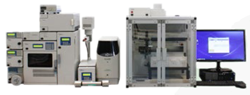
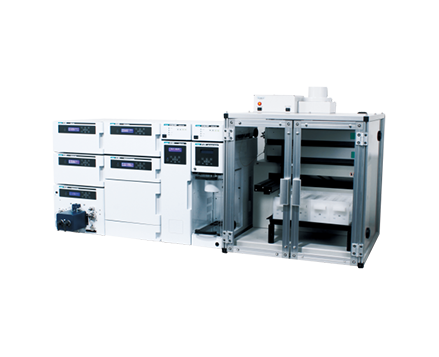
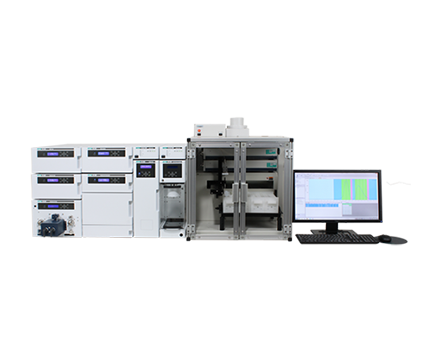
Instrument Figure 3. JASCO Semi-preparative SFC/PDA/ELSD system (JASCO Co., Tokyo, Japan).
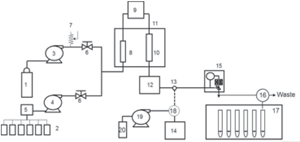
Figure 4. Schematic of the SFC/PDA/ELSD System
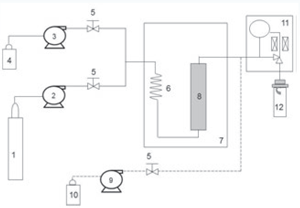
Figure 5. Flow diagram of the SFE System
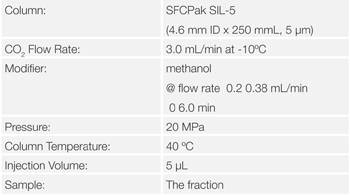
Columns: SFCpak SIL-5, 5μm, 4.6 mm ID x 250 mmL and SFCpak SIL-5SP, 5μm, 10.0 mm ID x 250 mmL
Results
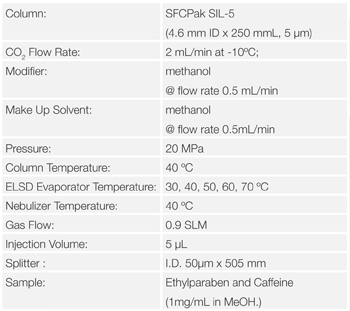
First of all, the parameters for the gas flow rate, evaporator temperature and nebulizer temperature were optimized in SFC. These parameter are specific parameter for ELSD. Ethylparaben (Figure 6) and caffeine (Figure 7) were used as standard sample.
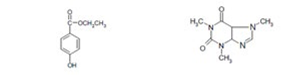
Figure 8 shows the chromatograms of Ethylparaben and caffeine when the gas flow rate is changed. Figure 9 shows the effect of gas flow rate on the areas for Ehylparaben and caffeine. The areas for Ehylparaben and caffeine were decreased as the gas flow rate was increased. In the case of SFC, CO2 enters in the detector probe, and the gas flow rate is the total of CO2 and gas flow rates. For this reason, it is thought that the sensitivity becomes higher as the gas flow rate is small.
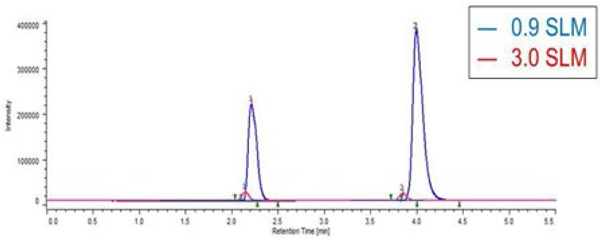
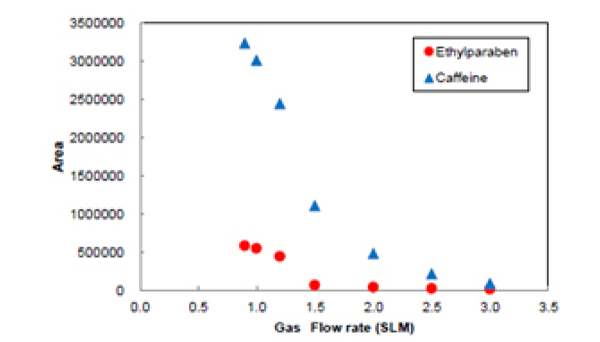
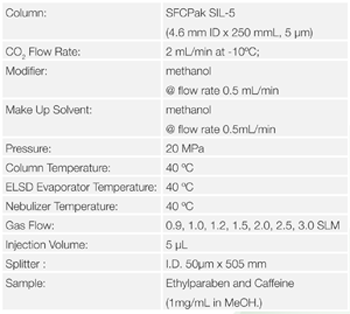
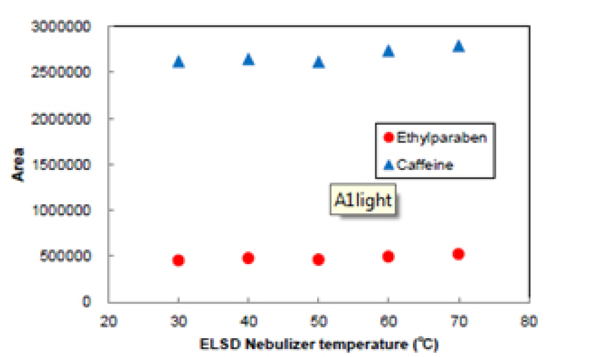
Figure 10 shows the chromatograms of Ethylparaben and caffeine when the evaporator temperature is changed. Figure 11 shows the effect of evaporator temperature on the areas for Ethylparaben and caffeine. The evaporator temperature depends on the volatility of sample.
The area for Ethylparaben, which is a semi-volatile organic compound, was decreased as the temperature was increased. On the other hand, the area for caffeine, which has low volatility, was almost the same when the temperature was 30 ºC or more.
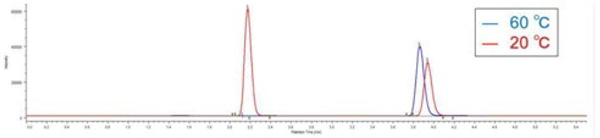
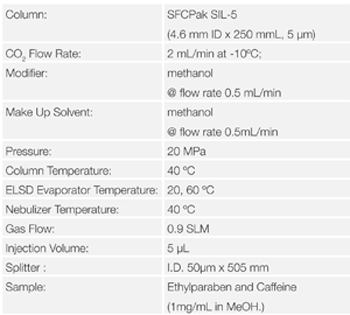
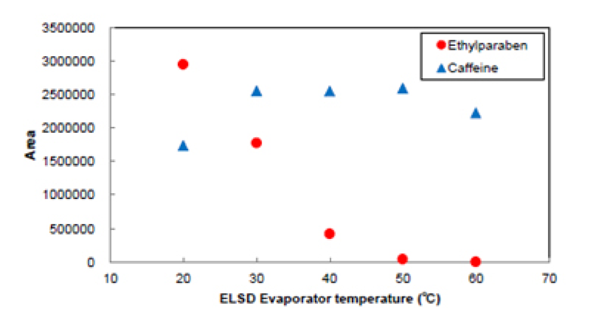
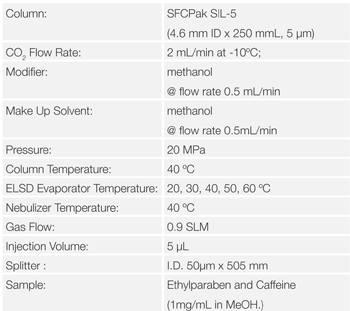
Figure 12 shows the effect nebulizer temperature on the areas for Ethylparaben and caffeine. The areas were not changed as the temperature was changed. This shows that the nebulizer temperature is not effected on the areas for these samples.
When using an ELSD with SFC a splitter must be used as the total volume of CO2 from the back pressure regulator would be too excessive for the detector.
A typical splitter is made by capillary tube. A part of sample stream is split by this and introduced into the detector probe. The split ratio is decided by the inner diameter and length of capillary tube. However, it varies with the temperature, pressure and flow rate.
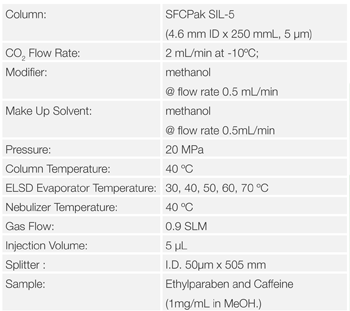
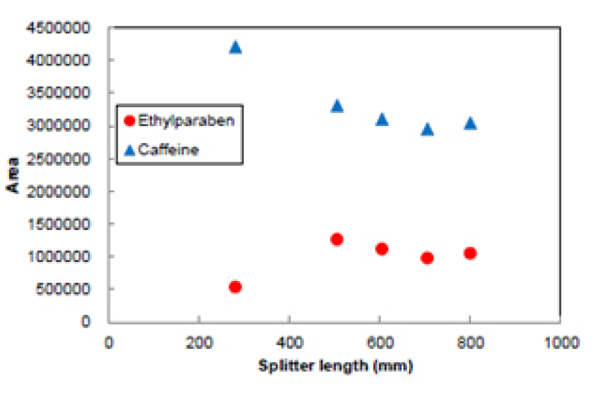
Figure 13 shows the effect of splitter length on the peak areas for Ethylparaben and caffeine.The peak area for caffeine became smaller as the length of the splitter was increased as the split ratio was reduced. Ethylparaben shows similar results to caffeine but if the capillary length is too short the CO2 flow rate through the detector becomes too great and impacts on sensitivity.
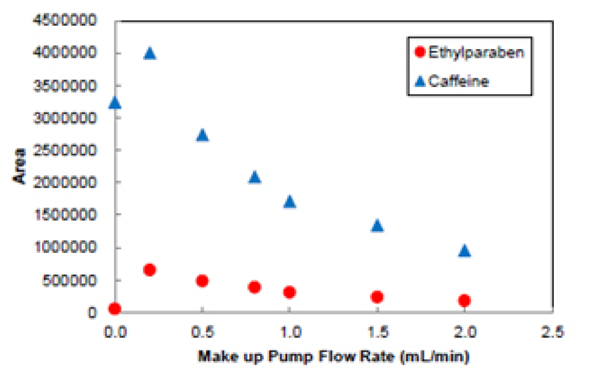
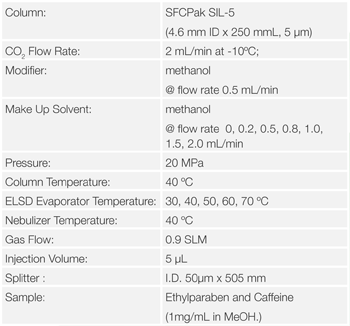
In the case of SFC, the solvent exhausted from the splitter outlet is an aerosol due to the CO2. At this point the solubility of the sample drops, and there is increased risk of sample plugging the tube. Pumping a make-up flow solvent prior to the splitter can prevent blockage of the capillaryand gives stabile detection when measuring samples with a concentration,for example with preparative SFC.
Figure 14 shows the relationship between the peak area of Ethylparaben and caffeine andthe variation in make-up pump flow rate. Without make-up solvent the sensitivity is reduced, but with a small make-up flow the sensitivity increases until a point where it starts to decrease, most likely caused by a dilution effect or poor evaporation due to too much liquid.
ELSD Parameters Summary
Newbulizer Gas Flow Rate
Low flow rate provides high sensitivity. Optimum gas flow rate is 0.8 – 1.0 SLM.
Evaporator Temperature
The evaporator temperature setting depends on the volatility of the sample. To detect samples with higher volatility the optimum evaporator temperature is 20-40 ºC.
Nebulizer temperature
The nebulizer temperature does not effect on the sensitivity.
Splitter length
The sensitivity changes with the length of the splitter. However, the sensitivity decreased with increased CO2 flow rate. This is sample dependent.
Make up pump flow rate
Make-up solvent should be used and optimized for Preparative SFC/ELSD to prevent clogging of the tubing.
Purification of Parthenolide in Feverfew by SFE and SFC
SFE
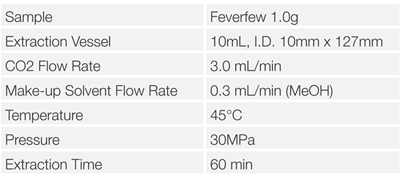
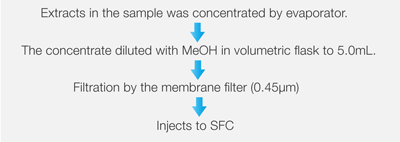
Feverfew was extracted using the SFE system shown in Figure 4, referring to the Reference2). The SFE conditions are shown in Table I. The preparation after the extraction was shown in Figure 15.
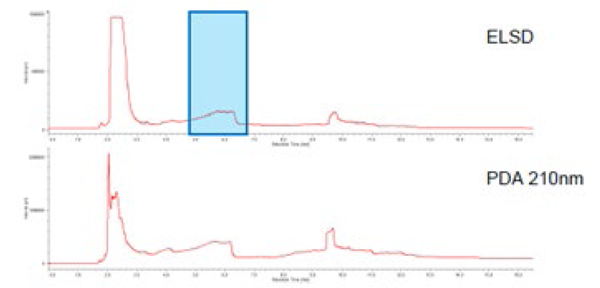
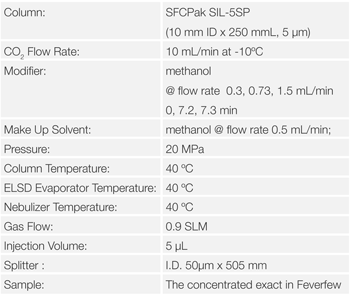
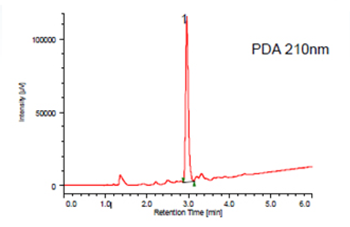
The Feverfew sample was extracted by SFE, pre-treated and then separated by semi preparative SFC, the Parthenolide was fractionated and collected.Figure 16 shows the semi-preparative separation of the Feverfew extract. The peak shown in the blue rectangle was collected as afraction and analyzed and identified by analytical SFC. Figure 17 shows the analytical separation. By comparing the peak area with that for a standard sample of Parthenolide, we confirmed that 0.03mg/g of Partheno lide was collected.
Featured Products:
-
SFC-4000 Semi-Preparative SFC for semi-preparative scale purifications.
Semi-Preparative SFC System
-
SFC-4000 Hybrid SFC for analytical and semi-preparative SFC.
Hybrid SFC System
-
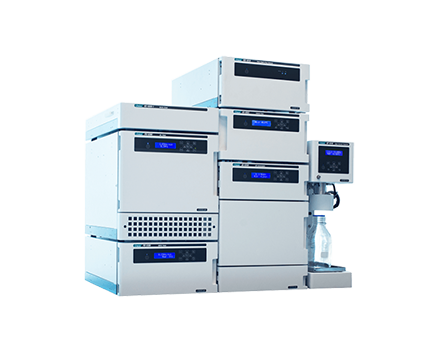
SFC-4000 Analytical SFC for routine separation to method development.
Analytical SFC System

Purification of Parthenolide in Feverfew by SFE & SFC with Evaporative Light Scattering Detection
Introduction
An evaporative light scattering detector (ELSD) can be used for the detection of a wide variety of compounds including those that do not have any specific properties such as UV absorption with the exception for volatile compounds. When ELSD is used in supercritical fluid chromatography (SFC), the detection parameters in ELSD should be optimized because the chromatogram shows specific behavior in SFC. In this presentation we measured the behavior of the chromatogram by changing those parameters.
Fever few (Tanacetumparthenium, Figure 1) is a medicinal herb and contains sesquiterpene lactone [Parthenolide (Figure 2) is reported to be active principle]. In this presentation, we tried to purify Parthenolide in feverfew by Supercritical fluid extraction (SFE) and the subsequent SFC with ELS detection.
Experimental
Instrument Figure 3. JASCO Semi-preparative SFC/PDA/ELSD system (JASCO Co., Tokyo, Japan).
Figure 4. Schematic of the SFC/PDA/ELSD System
Figure 5. Flow diagram of the SFE System
Columns: SFCpak SIL-5, 5μm, 4.6 mm ID x 250 mmL and SFCpak SIL-5SP, 5μm, 10.0 mm ID x 250 mmL
Results
First of all, the parameters for the gas flow rate, evaporator temperature and nebulizer temperature were optimized in SFC. These parameter are specific parameter for ELSD. Ethylparaben (Figure 6) and caffeine (Figure 7) were used as standard sample.
Figure 8 shows the chromatograms of Ethylparaben and caffeine when the gas flow rate is changed. Figure 9 shows the effect of gas flow rate on the areas for Ehylparaben and caffeine. The areas for Ehylparaben and caffeine were decreased as the gas flow rate was increased. In the case of SFC, CO2 enters in the detector probe, and the gas flow rate is the total of CO2 and gas flow rates. For this reason, it is thought that the sensitivity becomes higher as the gas flow rate is small.
Figure 10 shows the chromatograms of Ethylparaben and caffeine when the evaporator temperature is changed. Figure 11 shows the effect of evaporator temperature on the areas for Ethylparaben and caffeine. The evaporator temperature depends on the volatility of sample.
The area for Ethylparaben, which is a semi-volatile organic compound, was decreased as the temperature was increased. On the other hand, the area for caffeine, which has low volatility, was almost the same when the temperature was 30 ºC or more.
Figure 12 shows the effect nebulizer temperature on the areas for Ethylparaben and caffeine. The areas were not changed as the temperature was changed. This shows that the nebulizer temperature is not effected on the areas for these samples.
When using an ELSD with SFC a splitter must be used as the total volume of CO2 from the back pressure regulator would be too excessive for the detector.
A typical splitter is made by capillary tube. A part of sample stream is split by this and introduced into the detector probe. The split ratio is decided by the inner diameter and length of capillary tube. However, it varies with the temperature, pressure and flow rate.
Figure 13 shows the effect of splitter length on the peak areas for Ethylparaben and caffeine.The peak area for caffeine became smaller as the length of the splitter was increased as the split ratio was reduced. Ethylparaben shows similar results to caffeine but if the capillary length is too short the CO2 flow rate through the detector becomes too great and impacts on sensitivity.
In the case of SFC, the solvent exhausted from the splitter outlet is an aerosol due to the CO2. At this point the solubility of the sample drops, and there is increased risk of sample plugging the tube. Pumping a make-up flow solvent prior to the splitter can prevent blockage of the capillaryand gives stabile detection when measuring samples with a concentration,for example with preparative SFC.
Figure 14 shows the relationship between the peak area of Ethylparaben and caffeine andthe variation in make-up pump flow rate. Without make-up solvent the sensitivity is reduced, but with a small make-up flow the sensitivity increases until a point where it starts to decrease, most likely caused by a dilution effect or poor evaporation due to too much liquid.
ELSD Parameters Summary
Newbulizer Gas Flow Rate
Low flow rate provides high sensitivity. Optimum gas flow rate is 0.8 – 1.0 SLM.
Evaporator Temperature
The evaporator temperature setting depends on the volatility of the sample. To detect samples with higher volatility the optimum evaporator temperature is 20-40 ºC.
Nebulizer temperature
The nebulizer temperature does not effect on the sensitivity.
Splitter length
The sensitivity changes with the length of the splitter. However, the sensitivity decreased with increased CO2 flow rate. This is sample dependent.
Make up pump flow rate
Make-up solvent should be used and optimized for Preparative SFC/ELSD to prevent clogging of the tubing.
Purification of Parthenolide in Feverfew by SFE and SFC
SFE
Feverfew was extracted using the SFE system shown in Figure 4, referring to the Reference2). The SFE conditions are shown in Table I. The preparation after the extraction was shown in Figure 15.
The Feverfew sample was extracted by SFE, pre-treated and then separated by semi preparative SFC, the Parthenolide was fractionated and collected.Figure 16 shows the semi-preparative separation of the Feverfew extract. The peak shown in the blue rectangle was collected as afraction and analyzed and identified by analytical SFC. Figure 17 shows the analytical separation. By comparing the peak area with that for a standard sample of Parthenolide, we confirmed that 0.03mg/g of Partheno lide was collected.