Quantitative Analysis of Powdered Solids with FTIR-ATR
August 11, 2022
 Download This Application
Introduction
Infrared quantitative analysis is an everyday requirement for the analytical laboratory. While liquid solutions are a common sample, mixtures of powdered components also exist and it is often desirable to obtain a quantitative result without dissolution into a solvent. This paper outlines the development of quantitative analysis methods for two powdered mixtures.

The traditional infrared analysis method for powdered samples is the collection of a KBr pellet spectrum of an aliquot of the powdered sample. However, preparation of KBr pellets requires some skill, especially for quantitative analyses. Attenuated Total Reflectance (ATR) accessories like a single-reflection micro-ATR provide a simple and effective alternative, suitable for the infrared analysis of powders.


The powdered sample is simply placed onto the ATR crystal and the sample spectrum is collected. Pressure up to 75 psi is evenly applied to the sample lying on the diamond microATR crystal during sample analysis. The sample is then cleaned from the crystal surface and the accessory is ready to collect additional spectra. ATR analysis is less complicated than using KBr pellets, is fast and a very small amount of the sample is needed.

To develop the quantitative analysis method, a number of standard powder ‘solutions’ of known concentration are prepared and spectra are collected from aliquots of the standards. Specified absorption bands are identified and the peak heights or areas calculated for the various standards. The resulting quantitative data is examined by least squares analysis based on Beer’s Law, A = abc. Where, A = the absorbance; a = the molar absorptivity of the analyte (a constant) ; b = the pathlength, and c = analyte concentration. ATR spectra cannot be used with a quantitative method developed using transmission spectra due to differences in the relative peak intensity of the absorption bands – a result of the internal reflection mechanism of ATR accessories. As an example, Figure 1 is a plot of the transmission and ATR spectra of caffeine. A least squares relationship can be drawn for ATR spectra of quantitative samples, however, similar to that for transmission data from KBr pellets.

Results
Micro-ATR spectra were collected using a Jasco 460-FTIR and a micro-ATR accessory equipped with ZnSe lenses and a single-reflection diamond ATR element. Sample aliquots of 5-10 milligrams were placed onto the ATR crystal and spectra were collected without additional sample preparation.
Aliquots drawn from the standard powders were mixed with KBr, and with a hand press, used to produce KBr pellets and provide transmission spectra for correlation with the microATR data. FT-IR spectra of 64 scans at 4 cm-1 resolution were coadded and averaged to obtain the single-beam background and sample micro-ATR spectra. 32 scans at 4cm-1 resolution were used to collect the single-beam background and KBr pellet transmission spectra. Figures 2 and 3 compare the fingerprint regions of the micro-ATR spectra of the components used in the study; caffeine and starch in the first mixture, Ibuprofen, and starch in the second. The analyte bands selected for the analysis of each component are labeled.
Three aliquots were analyzed for each powder standard using the micro-ATR and KBr pellet methods. Two analyte bands were selected for each component in each mixture and peak ratios were calculated based on the ratio of the peak heights of the active ingredient vs. the starch. An example of the repeatability of the micro-ATR measurement is demonstrated in Figure 4, containing three spectra of a 25% concentration of ibuprofen in starch.
Figure 5 is a least squares plot of the ATR data, following the 743 and 995 cm-1 bands for caffeine and starch, respectively. Figure 6 is the least squares plot of the KBr pellet data using the same analyte bands. Table 1 contains the R and R 2 values for the least squares analysis of the data from the two mixtures using the different analyte bands for each component. These results demonstrate that the micro-ATR method can provide repeatable quantitative results that are comparable to KBr pellet data.
| Caffeine/Starch Mixture | R | R2 |
|---|---|---|
| ATR - 743/995 cm-1 | 0.9738 | 0.9484 |
| ATR - 1546/1148 cm-1 | 0.9589 | 0.9196 |
| KBr - 743/995 cm-1 | 0.9764 | 0.9533 |
| KBr - 1546/1148 cm-1 | 0.9616 | 0.9246 |
| Ibuprofen/Starch Mixture | R | R2 |
| ATR - 1230/995 cm-1 | 0.9474 | 0.8976 |
| ATR - 779/1148 cm-1 | 0.9535 | 0.9091 |
| KBr - 1230/995 cm-1 | 0.9731 | 0.9469 |
| KBr - 779/1148 cm-1 | 0.9741 | 0.9489 |
Conclusion
A single reflection micro-ATR is an easy-to-use accessory for the analysis of powdered mixtures. The ATR technique is simple, rapid and very reliable for sample quantitation. The analysis method is non-destructive and can be used to collect data from a minimal amount of sample, providing quantitative results similar to KBr pellet spectra.
Featured Products:
-

Compact fixed range mid-IR spectrometer with options to extend to the NIR/FIR
FT/IR-4X
-
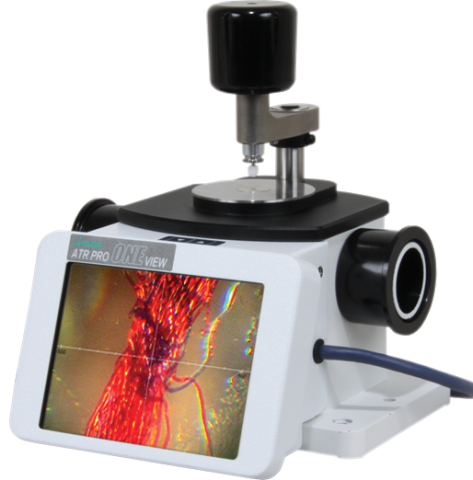
ATR Accessories

Quantitative Analysis of Powdered Solids with FTIR-ATR
Introduction
Infrared quantitative analysis is an everyday requirement for the analytical laboratory. While liquid solutions are a common sample, mixtures of powdered components also exist and it is often desirable to obtain a quantitative result without dissolution into a solvent. This paper outlines the development of quantitative analysis methods for two powdered mixtures.
The traditional infrared analysis method for powdered samples is the collection of a KBr pellet spectrum of an aliquot of the powdered sample. However, preparation of KBr pellets requires some skill, especially for quantitative analyses. Attenuated Total Reflectance (ATR) accessories like a single-reflection micro-ATR provide a simple and effective alternative, suitable for the infrared analysis of powders.
The powdered sample is simply placed onto the ATR crystal and the sample spectrum is collected. Pressure up to 75 psi is evenly applied to the sample lying on the diamond microATR crystal during sample analysis. The sample is then cleaned from the crystal surface and the accessory is ready to collect additional spectra. ATR analysis is less complicated than using KBr pellets, is fast and a very small amount of the sample is needed.
To develop the quantitative analysis method, a number of standard powder ‘solutions’ of known concentration are prepared and spectra are collected from aliquots of the standards. Specified absorption bands are identified and the peak heights or areas calculated for the various standards. The resulting quantitative data is examined by least squares analysis based on Beer’s Law, A = abc. Where, A = the absorbance; a = the molar absorptivity of the analyte (a constant) ; b = the pathlength, and c = analyte concentration. ATR spectra cannot be used with a quantitative method developed using transmission spectra due to differences in the relative peak intensity of the absorption bands – a result of the internal reflection mechanism of ATR accessories. As an example, Figure 1 is a plot of the transmission and ATR spectra of caffeine. A least squares relationship can be drawn for ATR spectra of quantitative samples, however, similar to that for transmission data from KBr pellets.
Results
Micro-ATR spectra were collected using a Jasco 460-FTIR and a micro-ATR accessory equipped with ZnSe lenses and a single-reflection diamond ATR element. Sample aliquots of 5-10 milligrams were placed onto the ATR crystal and spectra were collected without additional sample preparation.
Aliquots drawn from the standard powders were mixed with KBr, and with a hand press, used to produce KBr pellets and provide transmission spectra for correlation with the microATR data. FT-IR spectra of 64 scans at 4 cm-1 resolution were coadded and averaged to obtain the single-beam background and sample micro-ATR spectra. 32 scans at 4cm-1 resolution were used to collect the single-beam background and KBr pellet transmission spectra. Figures 2 and 3 compare the fingerprint regions of the micro-ATR spectra of the components used in the study; caffeine and starch in the first mixture, Ibuprofen, and starch in the second. The analyte bands selected for the analysis of each component are labeled.
Three aliquots were analyzed for each powder standard using the micro-ATR and KBr pellet methods. Two analyte bands were selected for each component in each mixture and peak ratios were calculated based on the ratio of the peak heights of the active ingredient vs. the starch. An example of the repeatability of the micro-ATR measurement is demonstrated in Figure 4, containing three spectra of a 25% concentration of ibuprofen in starch.
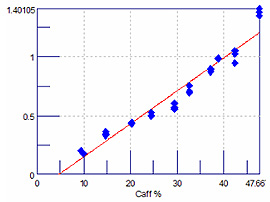
Figure 5 is a least squares plot of the ATR data, following the 743 and 995 cm-1 bands for caffeine and starch, respectively. Figure 6 is the least squares plot of the KBr pellet data using the same analyte bands. Table 1 contains the R and R 2 values for the least squares analysis of the data from the two mixtures using the different analyte bands for each component. These results demonstrate that the micro-ATR method can provide repeatable quantitative results that are comparable to KBr pellet data.
| Caffeine/Starch Mixture | R | R2 |
|---|---|---|
| ATR - 743/995 cm-1 | 0.9738 | 0.9484 |
| ATR - 1546/1148 cm-1 | 0.9589 | 0.9196 |
| KBr - 743/995 cm-1 | 0.9764 | 0.9533 |
| KBr - 1546/1148 cm-1 | 0.9616 | 0.9246 |
| Ibuprofen/Starch Mixture | R | R2 |
| ATR - 1230/995 cm-1 | 0.9474 | 0.8976 |
| ATR - 779/1148 cm-1 | 0.9535 | 0.9091 |
| KBr - 1230/995 cm-1 | 0.9731 | 0.9469 |
| KBr - 779/1148 cm-1 | 0.9741 | 0.9489 |
Conclusion
A single reflection micro-ATR is an easy-to-use accessory for the analysis of powdered mixtures. The ATR technique is simple, rapid and very reliable for sample quantitation. The analysis method is non-destructive and can be used to collect data from a minimal amount of sample, providing quantitative results similar to KBr pellet spectra.