Rapid Separation of Amino-Acids using UHPLC with OPA Pre-Column Derivatization
November 22, 2023
 Download This Application
Introduction
In this application note we report on a method for hiqh-speed automated amino-acid analysis using a UHPLC system with 2.0 mm semi-micro column packed with 2µm C18 stationary phase; this column can dramatically reduce the analysis time (compared with an analytical column) from 38 min down to 7 min; a five-fold improvement in the speed of analysis. The amino-acids were automatically derivatized with ortho-Phthalaldehyde (OPA) using an X-LC 3059AS autosampler, just prior to injection to ensure stable reproducible results.
Amino-acid analysis has been important in many applications ranging from food analysis to protein science. Many different separation and detection techniques have been employed over a long period of time. However, one of the most popular methods remains pre-column derivatization with OPA derivatization, separation using a C18 column and fluorescence detection, offering both simplicity and high sensitivity.
A typical separation normally uses a 4.6 mm I.D x 150 L (or 250 mm) C18 column with 5µm packing material requiring more than 40 mins for a complete analysis.
Experimental
Automated Pre-column Derivatization System
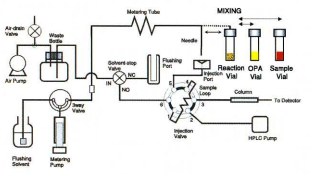
The derivatization of amino acids was performed automatically using a programmed autosampler, fig. 2 shows the flow diagram of the autosampler. The procedure for derivatizatlon is detailed below.
Procedure for automated pre-column derivatization
- Wash needle
- Draw reagent and sample with air segmentation
- Eject to reaction vial
- Mix sample and reagent by air bubbling
- Wash needle
- Pause to allow reaction to complete
- Draw derivatized sample
- Injection onto column
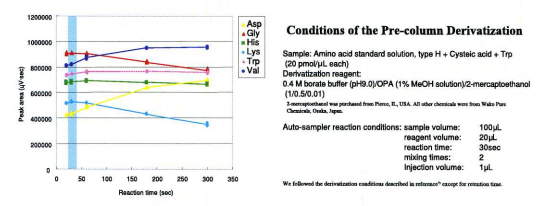
(1) Optimization of derivatization conditions
Peak areas of 6 amino-acids were plotted against derivatization reaction time as shown in fig. 3. The derivatives of glycine and lysine showed appreciable decay in fluorescence intensity when the reaction time exceeded 300 seconds. In addition, the lysine derivative has a very low response (as shown by the blue line in fig.3) compared with the derivatives of other amino acids. This phenomenon was also observed by Jones 1). A reaction time of 30 seconds was considered optimal.
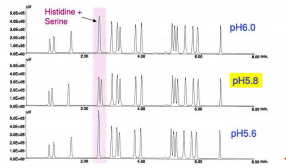
(2) Optimization of Separation Conditions
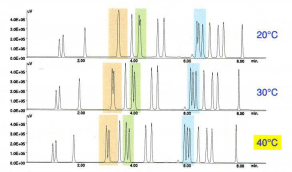
As shown in fig. 4, pH greatly affected the separation of the histidine and serine derivatives – pH 5.8 was selected. The column temperature also has a significant effect on the separation, shown in orange, green and blue in fig. 5. The column temperature was set to 40°C.
Optimized conditions
Eluent A: 1.0M citrate buffer (pH5.8) 3.5mL in 1L of H20
Eluent B: 1.0M citrate buffer (pH5.8) 3.5mL in 1L of CH3CN/C2H5OH/H2O (30/30/40)
Gradient condition: 1 cycle 10min
A:B = 90:10 – 90:10 – 72:28 – 72:28 – 42:58 – 42:58 – 23:77 – 0:100 – 0:100 – 90:10
0.2min 2.2min 2.5min 4.6min 5.0min 6.1min 6.15mln 7.0min 7.05min
Flow rate: 0.6mL/min
Column: X-PressPak V-C18 (2-µm dia., 2.0mm 1.0. x 5Omm)
Column temperature: 40°C
Detection: Fluorescence; Ex 345nm, Em 455nm; Gain x100
Results
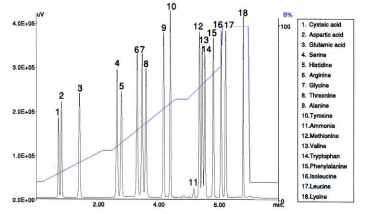
This separation was performed under optimized conditions as shown in fig. 6. The blue line represents the gradient profile (%B).
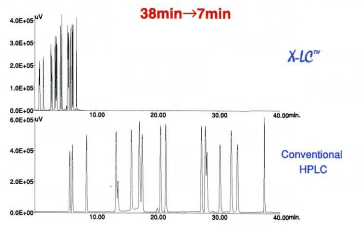
Fig. 7 compares UHPLC with conventional HPLC, extremely fast separation was achieved using UHPLC – the total analysis time was reduced by 80%. and solvent consumption reduced by 90%.
(1) Precision
Reproducibility of Retention Time and Peak Area
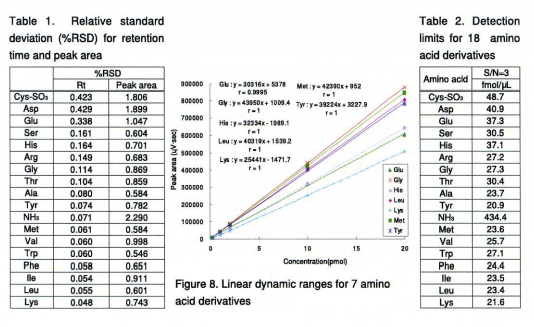
Reproducibility of peak areas and retention times were calculated from ten replicate injections of 8 amino-acid standards (20pmol each), as shown in Table 1. The relative standard deviations (RSD) were between 0.048 and 0.429% for the retention times, and between 0.546 and 1.90% for the peak areas. Excellent reproducibility of the retention times and peak areas were observed.
Linear Dynamic Range and Detection Limit
Figure 8 shows the linear dynamic range for selected amino acid derivatives. Correlation coefficients (r) were also calculated using the results from the analysis of 7 amino-acid derivatives ranging from 0.2 to 20pmol. Excellent linearity was observed.
Highly sensitive detection was achieved using a fluorescence detector; the detection limit (LOD SN>=3) was between 21 and 49 fmol/µL as shown in Table 2.
(2) Applications in Food Analysis
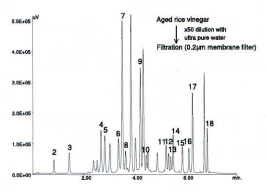
Aged rice vinegar contains various amino-acids and minerals. Seventeen amino-acids were detected.
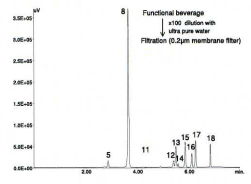
This beverage contained 9 essential amino-acids, i.e., His, Thr, Met, Val, Trp, Phe, lie, Leu and Lys.
Analysis of other amino-acids
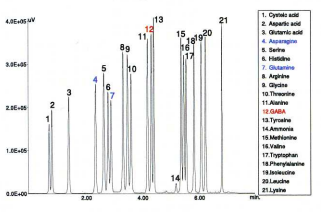
Figure 12 shows a chromatogram of a standard mixture of 2 amino-acids containing GABA (gamma-aminobutyric acid). GABA is an important inhibitory neurotransmitter in the central nervous system and essential for brain metabolism and function. Asparagine and glutamine were included in this standard in addition to GABA. The analysis conditions were the same as shown in fig. 6.
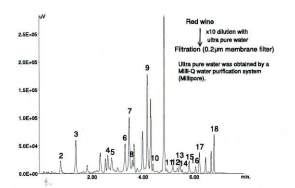
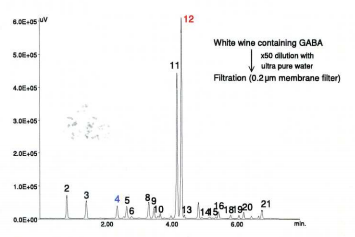
Figure 13 shows the chromatogram of amino-acids in white wine containing GABA. The label of this wine showed ingredients including lychee juice, which is known to be a good source of GABA. The conditions are the same as shown in fig. 6.
Analysis of Theanine
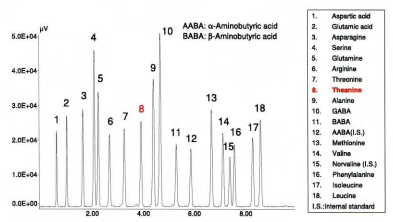
Theanine (L-γ-glutamylethylamide) is an analog of glutamine, found almost exclusively in tea plants (and fungi) and can induce a feeling of relaxation. Theanine has a sweet and umami taste and shows a strong correlation with the quality of Japanese green tea. Figure 14 shows a chromatogram of a standard mixture of 18 amino-acids, including theanine. The conditions are different from those used in fig. 6.; the standard contained two additional internal standards – MBA and norvaline. MBA was used as an internal standard for the analysis of green tea, and norvaline for the analysis of black tea; because it is difficult to separate impurity peaks from MBA.
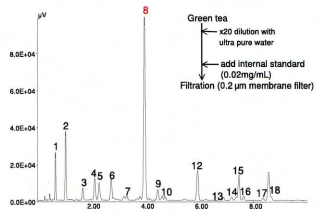
Figure 15 shows the chromatogram of amino-acids of green tea. It should be noted that the green tea contains a large amount of theanine, and is the major component among the range of amino- acids present.
Conditions for the Analysis of Theanine
The separation conditions were selected for the analysis of amino-acids including theanine in tea, this used binary gradient elution with an ethanol-citrate buffer mobile phase.
Eluent A: 1.0M citrate buffer (pH6.0) 3.5mL in 1L of C2H5OH/H2O (12/88)
Eluent B: 1.0M citrate buffer (pH6.0) 3.5mL in 1L of C2H5OH/H2O (50/50)
Gradient condition: 14 min
A:B = 100:0 – 0:85 – 0:85 – 100:0
9.0 min 0.5 min 0.05 min
Flow rate: 0.4mL/min
Column: X-PressPak V-C18 (2µm dia., 2.0mm I.D. x 50mm)
Column temperature: 40°C
Detection: Fluorescence; Ex 340nm,Em 450nm; Gain x 100
Conclusion
- High-Speed
Total analysis time: ca 1/5 (38 min-7 min) - Reduced Solvent Consumption
Amount ratio: ca 1/10 (60 mL~6 mL) - High Sensitivity Detection
Detection limit (SN>=3): 21 – 49 fmol/L - Excellent Reproducibility (n=10)
RSD%: 0.05 – 0.43% (retention time), 0.58 – 1.90% (peak area) - Applicable in a wide variety of Food Analysis
Featured Products:

Rapid Separation of Amino-Acids using UHPLC with OPA Pre-Column Derivatization
Introduction
In this application note we report on a method for hiqh-speed automated amino-acid analysis using a UHPLC system with 2.0 mm semi-micro column packed with 2µm C18 stationary phase; this column can dramatically reduce the analysis time (compared with an analytical column) from 38 min down to 7 min; a five-fold improvement in the speed of analysis. The amino-acids were automatically derivatized with ortho-Phthalaldehyde (OPA) using an X-LC 3059AS autosampler, just prior to injection to ensure stable reproducible results.
Amino-acid analysis has been important in many applications ranging from food analysis to protein science. Many different separation and detection techniques have been employed over a long period of time. However, one of the most popular methods remains pre-column derivatization with OPA derivatization, separation using a C18 column and fluorescence detection, offering both simplicity and high sensitivity.
A typical separation normally uses a 4.6 mm I.D x 150 L (or 250 mm) C18 column with 5µm packing material requiring more than 40 mins for a complete analysis.
Experimental
Automated Pre-column Derivatization System
The derivatization of amino acids was performed automatically using a programmed autosampler, fig. 2 shows the flow diagram of the autosampler. The procedure for derivatizatlon is detailed below.
Procedure for automated pre-column derivatization
- Wash needle
- Draw reagent and sample with air segmentation
- Eject to reaction vial
- Mix sample and reagent by air bubbling
- Wash needle
- Pause to allow reaction to complete
- Draw derivatized sample
- Injection onto column
(1) Optimization of derivatization conditions
Peak areas of 6 amino-acids were plotted against derivatization reaction time as shown in fig. 3. The derivatives of glycine and lysine showed appreciable decay in fluorescence intensity when the reaction time exceeded 300 seconds. In addition, the lysine derivative has a very low response (as shown by the blue line in fig.3) compared with the derivatives of other amino acids. This phenomenon was also observed by Jones 1). A reaction time of 30 seconds was considered optimal.
(2) Optimization of Separation Conditions
As shown in fig. 4, pH greatly affected the separation of the histidine and serine derivatives – pH 5.8 was selected. The column temperature also has a significant effect on the separation, shown in orange, green and blue in fig. 5. The column temperature was set to 40°C.
Optimized conditions
Eluent A: 1.0M citrate buffer (pH5.8) 3.5mL in 1L of H20
Eluent B: 1.0M citrate buffer (pH5.8) 3.5mL in 1L of CH3CN/C2H5OH/H2O (30/30/40)
Gradient condition: 1 cycle 10min
A:B = 90:10 – 90:10 – 72:28 – 72:28 – 42:58 – 42:58 – 23:77 – 0:100 – 0:100 – 90:10
0.2min 2.2min 2.5min 4.6min 5.0min 6.1min 6.15mln 7.0min 7.05min
Flow rate: 0.6mL/min
Column: X-PressPak V-C18 (2-µm dia., 2.0mm 1.0. x 5Omm)
Column temperature: 40°C
Detection: Fluorescence; Ex 345nm, Em 455nm; Gain x100
Results
This separation was performed under optimized conditions as shown in fig. 6. The blue line represents the gradient profile (%B).
Fig. 7 compares UHPLC with conventional HPLC, extremely fast separation was achieved using UHPLC – the total analysis time was reduced by 80%. and solvent consumption reduced by 90%.
(1) Precision
Reproducibility of Retention Time and Peak Area
Reproducibility of peak areas and retention times were calculated from ten replicate injections of 8 amino-acid standards (20pmol each), as shown in Table 1. The relative standard deviations (RSD) were between 0.048 and 0.429% for the retention times, and between 0.546 and 1.90% for the peak areas. Excellent reproducibility of the retention times and peak areas were observed.
Linear Dynamic Range and Detection Limit
Figure 8 shows the linear dynamic range for selected amino acid derivatives. Correlation coefficients (r) were also calculated using the results from the analysis of 7 amino-acid derivatives ranging from 0.2 to 20pmol. Excellent linearity was observed.
Highly sensitive detection was achieved using a fluorescence detector; the detection limit (LOD SN>=3) was between 21 and 49 fmol/µL as shown in Table 2.
(2) Applications in Food Analysis
Aged rice vinegar contains various amino-acids and minerals. Seventeen amino-acids were detected.
This beverage contained 9 essential amino-acids, i.e., His, Thr, Met, Val, Trp, Phe, lie, Leu and Lys.
Analysis of other amino-acids
Figure 12 shows a chromatogram of a standard mixture of 2 amino-acids containing GABA (gamma-aminobutyric acid). GABA is an important inhibitory neurotransmitter in the central nervous system and essential for brain metabolism and function. Asparagine and glutamine were included in this standard in addition to GABA. The analysis conditions were the same as shown in fig. 6.
Figure 13 shows the chromatogram of amino-acids in white wine containing GABA. The label of this wine showed ingredients including lychee juice, which is known to be a good source of GABA. The conditions are the same as shown in fig. 6.
Analysis of Theanine
Theanine (L-γ-glutamylethylamide) is an analog of glutamine, found almost exclusively in tea plants (and fungi) and can induce a feeling of relaxation. Theanine has a sweet and umami taste and shows a strong correlation with the quality of Japanese green tea. Figure 14 shows a chromatogram of a standard mixture of 18 amino-acids, including theanine. The conditions are different from those used in fig. 6.; the standard contained two additional internal standards – MBA and norvaline. MBA was used as an internal standard for the analysis of green tea, and norvaline for the analysis of black tea; because it is difficult to separate impurity peaks from MBA.
Figure 15 shows the chromatogram of amino-acids of green tea. It should be noted that the green tea contains a large amount of theanine, and is the major component among the range of amino- acids present.
Conditions for the Analysis of Theanine
The separation conditions were selected for the analysis of amino-acids including theanine in tea, this used binary gradient elution with an ethanol-citrate buffer mobile phase.
Eluent A: 1.0M citrate buffer (pH6.0) 3.5mL in 1L of C2H5OH/H2O (12/88)
Eluent B: 1.0M citrate buffer (pH6.0) 3.5mL in 1L of C2H5OH/H2O (50/50)
Gradient condition: 14 min
A:B = 100:0 – 0:85 – 0:85 – 100:0
9.0 min 0.5 min 0.05 min
Flow rate: 0.4mL/min
Column: X-PressPak V-C18 (2µm dia., 2.0mm I.D. x 50mm)
Column temperature: 40°C
Detection: Fluorescence; Ex 340nm,Em 450nm; Gain x 100
Conclusion
- High-Speed
Total analysis time: ca 1/5 (38 min-7 min) - Reduced Solvent Consumption
Amount ratio: ca 1/10 (60 mL~6 mL) - High Sensitivity Detection
Detection limit (SN>=3): 21 – 49 fmol/L - Excellent Reproducibility (n=10)
RSD%: 0.05 – 0.43% (retention time), 0.58 – 1.90% (peak area) - Applicable in a wide variety of Food Analysis