Secondary Structure Estimation for Formulated Monoclonal Antibodies using JASCO Spectra Manager™ 2.5 BeStSel CFR
January 13, 2025
 Download This Application
Introduction
Higher order structure (HOS) is an important physicochemical property of antibody drugs.1) The most well-known method for HOS characterization is circular dichroism (CD) spectroscopy. Although CD spectroscopy can provide robust structural information for low-concentration protein solutions (< ≈0.1 mg/mL), antibody drugs are formulated at concentrations higher than 10 mg/mL. Under these conditions, the antibody molecules can exhibit physicochemical properties that differ from those under dilute conditions. Fortunately, evaluation of high concentration solutions can be done via short CD path lengths (~10 mm) or using FTIR with ATR. The ability to perform structural characterization of antibodies without dilution is extremely important because intermolecular interactions and changes in the HOS can lead to the formation of aggregates that cause serious immunogenicity.
Secondary structure estimation offers a route to evaluate protein higher order structure, but historically has not worked well on proteins with high amounts of b-sheet such as antibodies. Recently, Micsonai et al. developed the BeStSel algorithm that can accurately estimate the secondary structure from a CD spectrum by taking into account parallel-antiparallel orientations of b-strands and the twist of antiparallel b-sheets. BeStSel has the following features: 1) high estimation accuracy for a wide range of proteins, including b-strand-rich proteins such as antibodies, 2) provides eight types of secondary structure information, 3) capability to predict protein folding following the CATH classification, and 4) open web server.2-6)
While many academic researchers use the BeStSel web server, researchers in biopharma companies who need to work in a GxP environment have not been able to benefit from BeStSel. To make BeStSel accessible to biopharma, we developed Spectra Manager™ Ver.2.5 CFR BeStSel as an add-in software for Spectra Manager™, a control and analysis platform for JASCO CD spectrometers, which is compatible with GxP.
Here, we describe an expanded application of CD spectroscopy for highly concentrated antibodies (undiluted) and report the results of a detailed secondary structure evaluation of antibody drugs using Spectra Manager™ Ver.2.5 CFR BeStSel.
Experimental
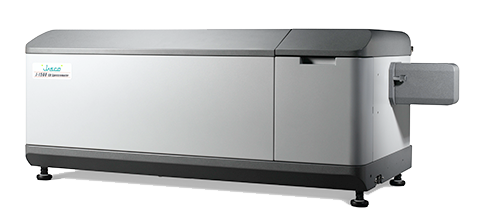
Measurement with J-1500 CD Spectrometer
- Simultaneous CD/absorbance measurements with high accuracy
- High throughput and high sensitivity
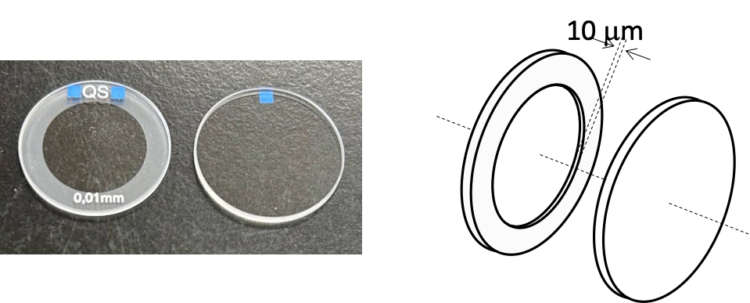 Short Pathlength Cuvette
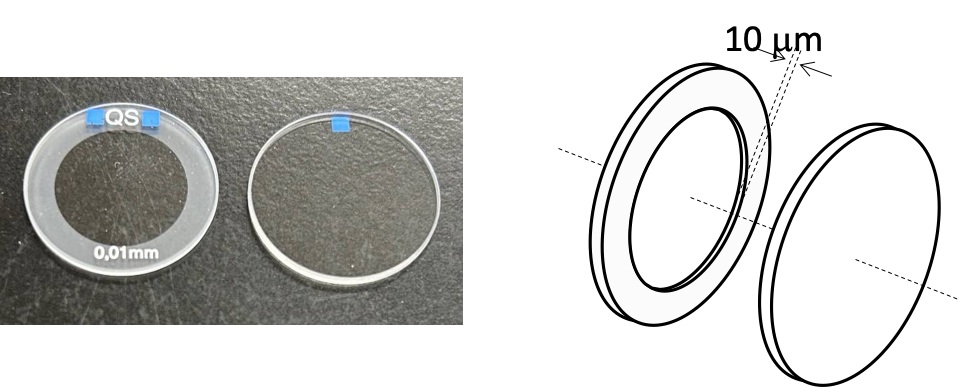
- Optical pathlength: 10 µm
- Required sample volume: 6 µL
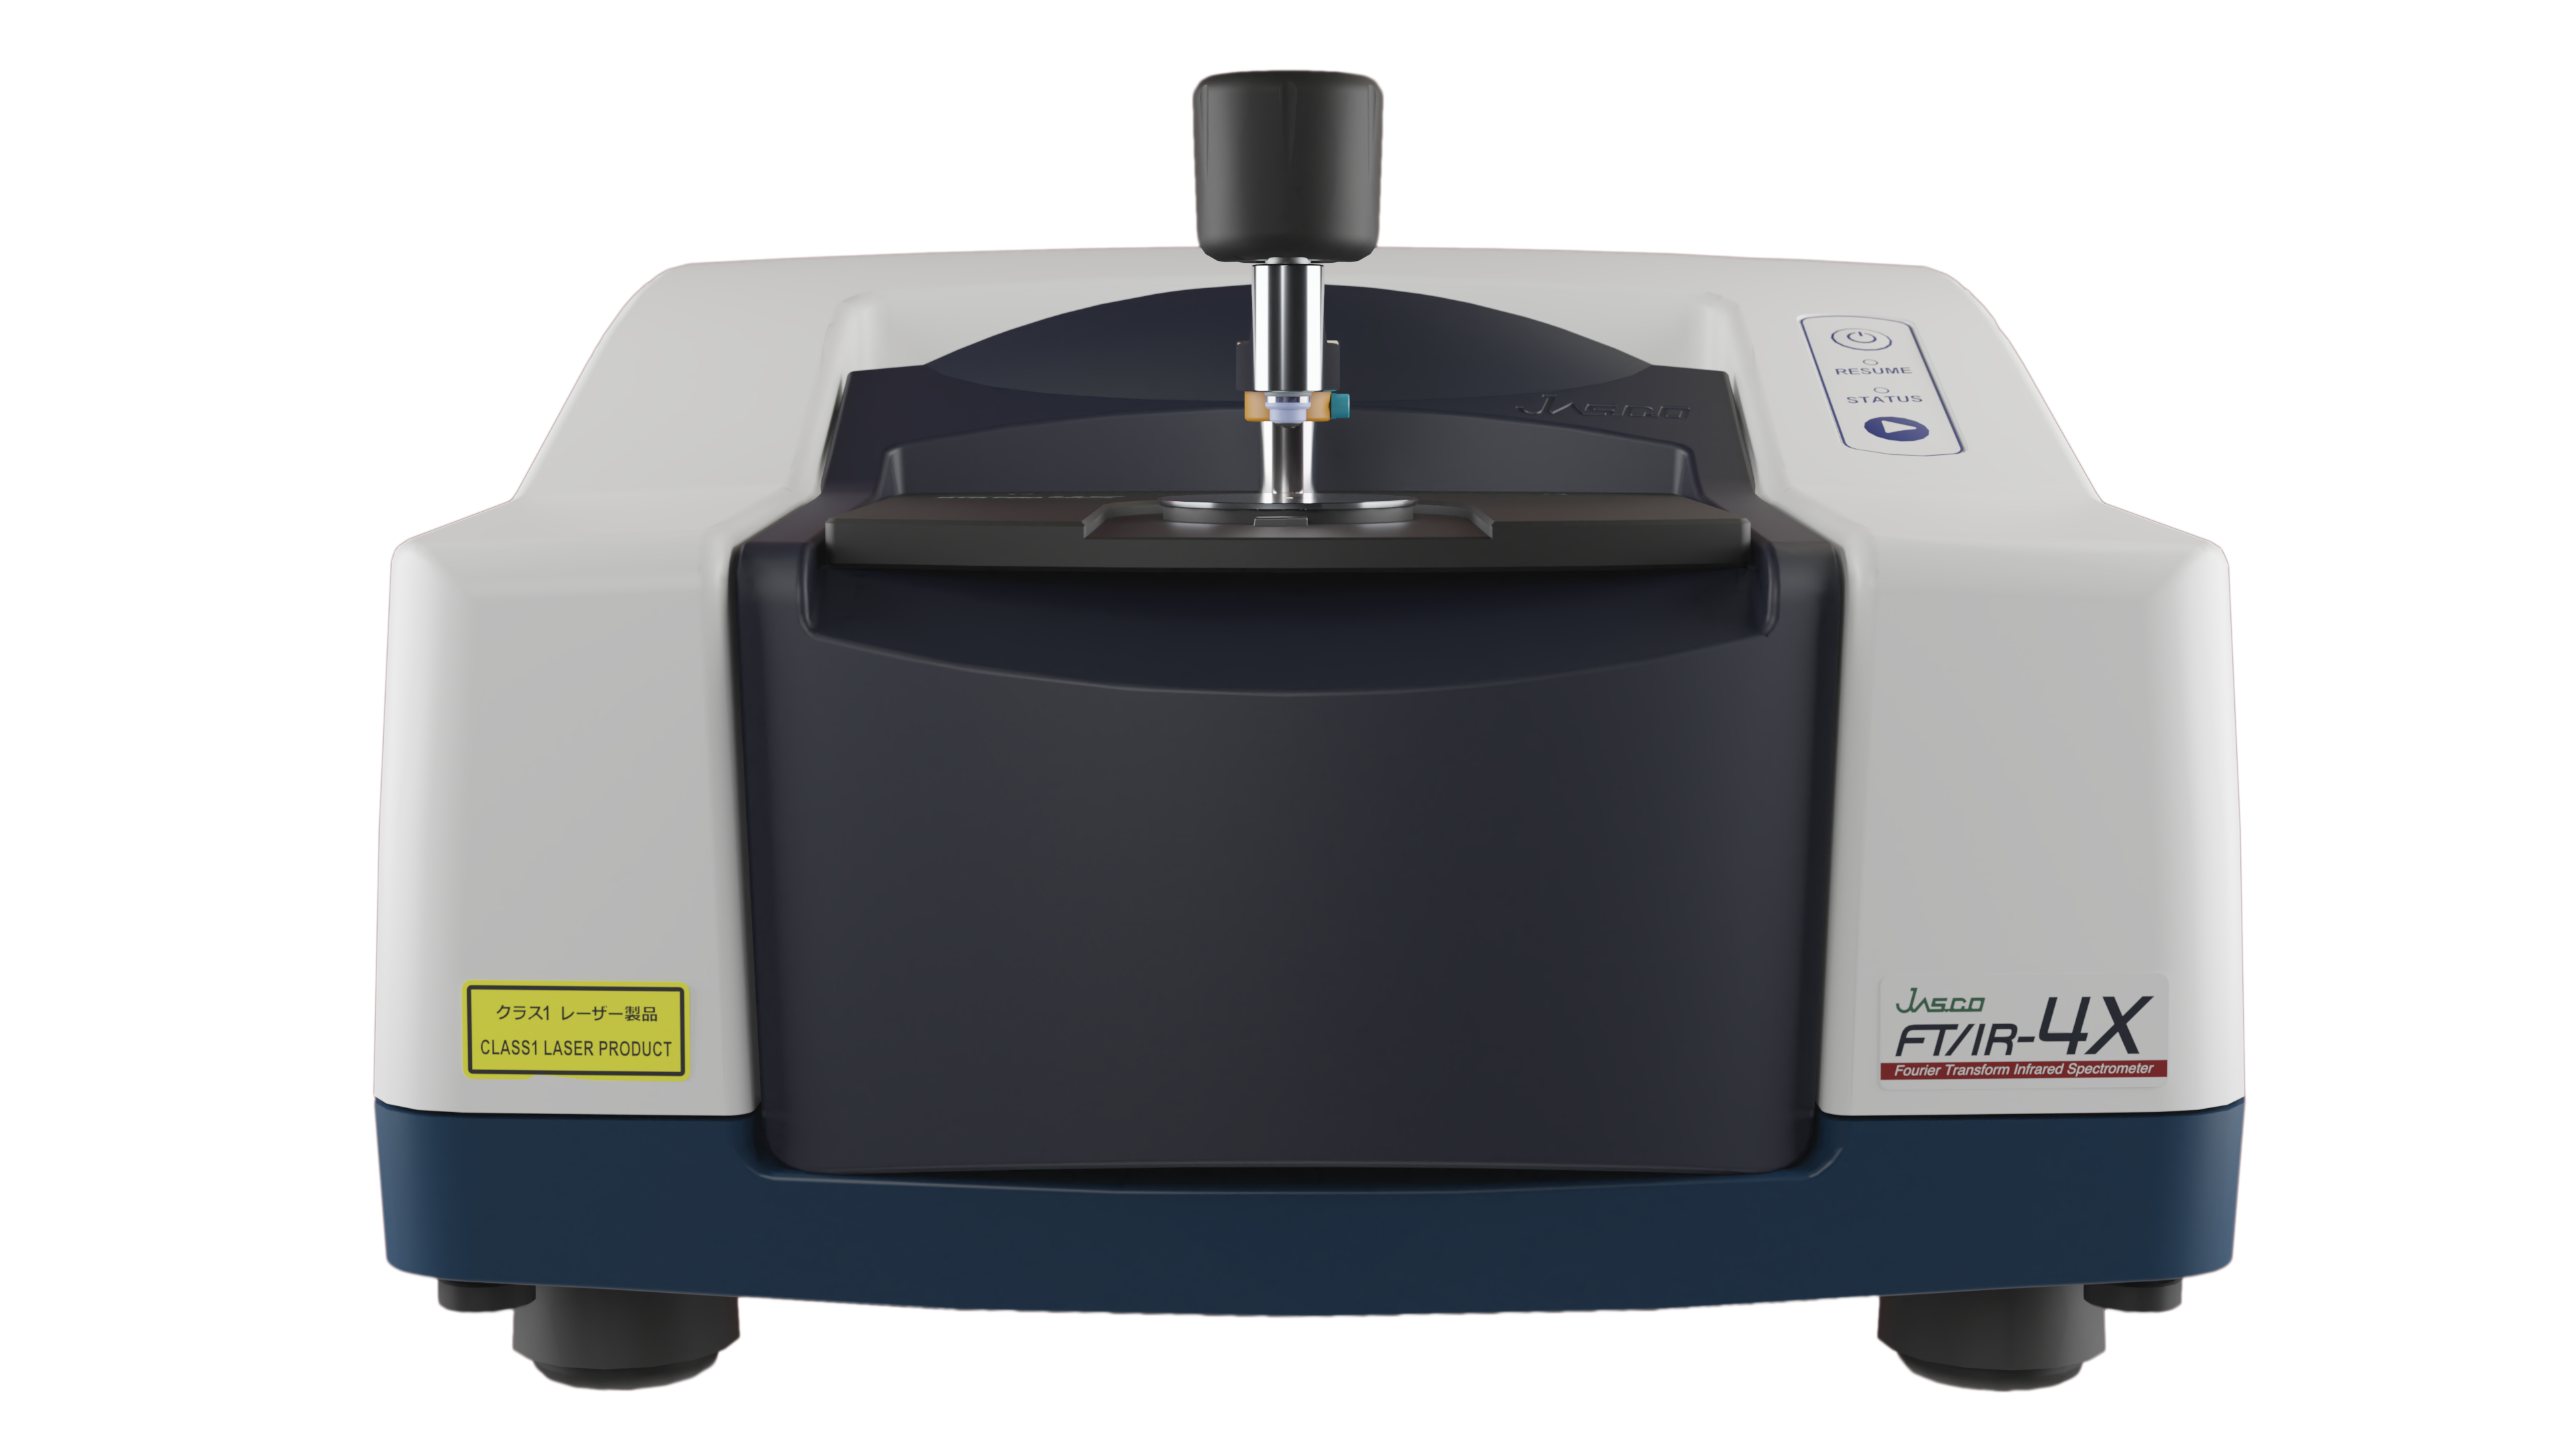
FT/IR-4X FTIR Spectrometer equipped with ATR PRO 4X
- High S/N ratio and resolution with compact size
- Proteins easily measured by placing one drop of sample on ATR PRO 4X
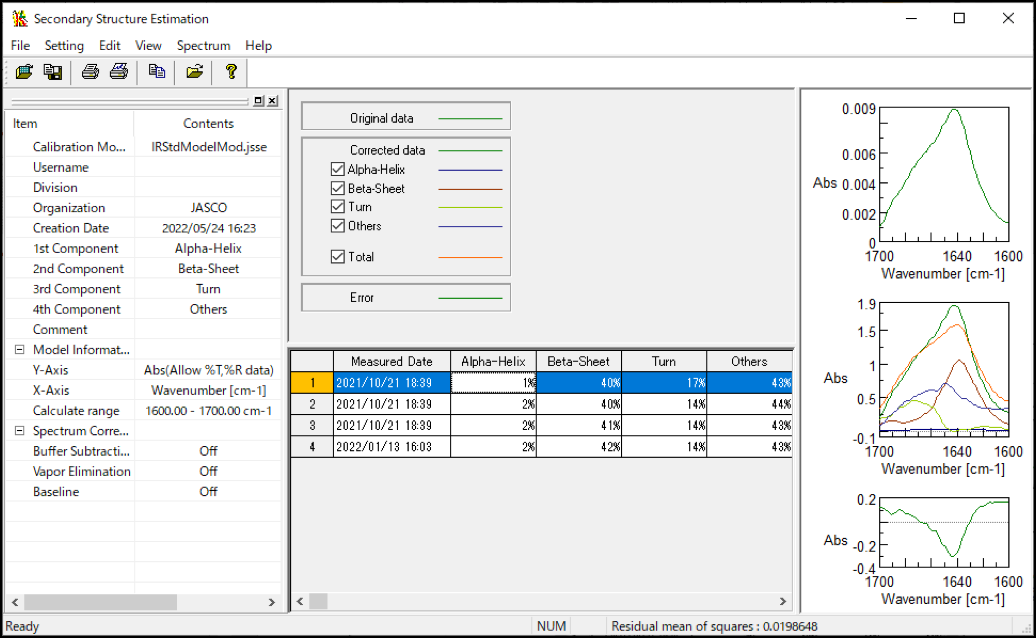 IR SSE-4X Secondary Structure Estimation Program
- SSE accuracy improved by addition of protein spectra to reference model
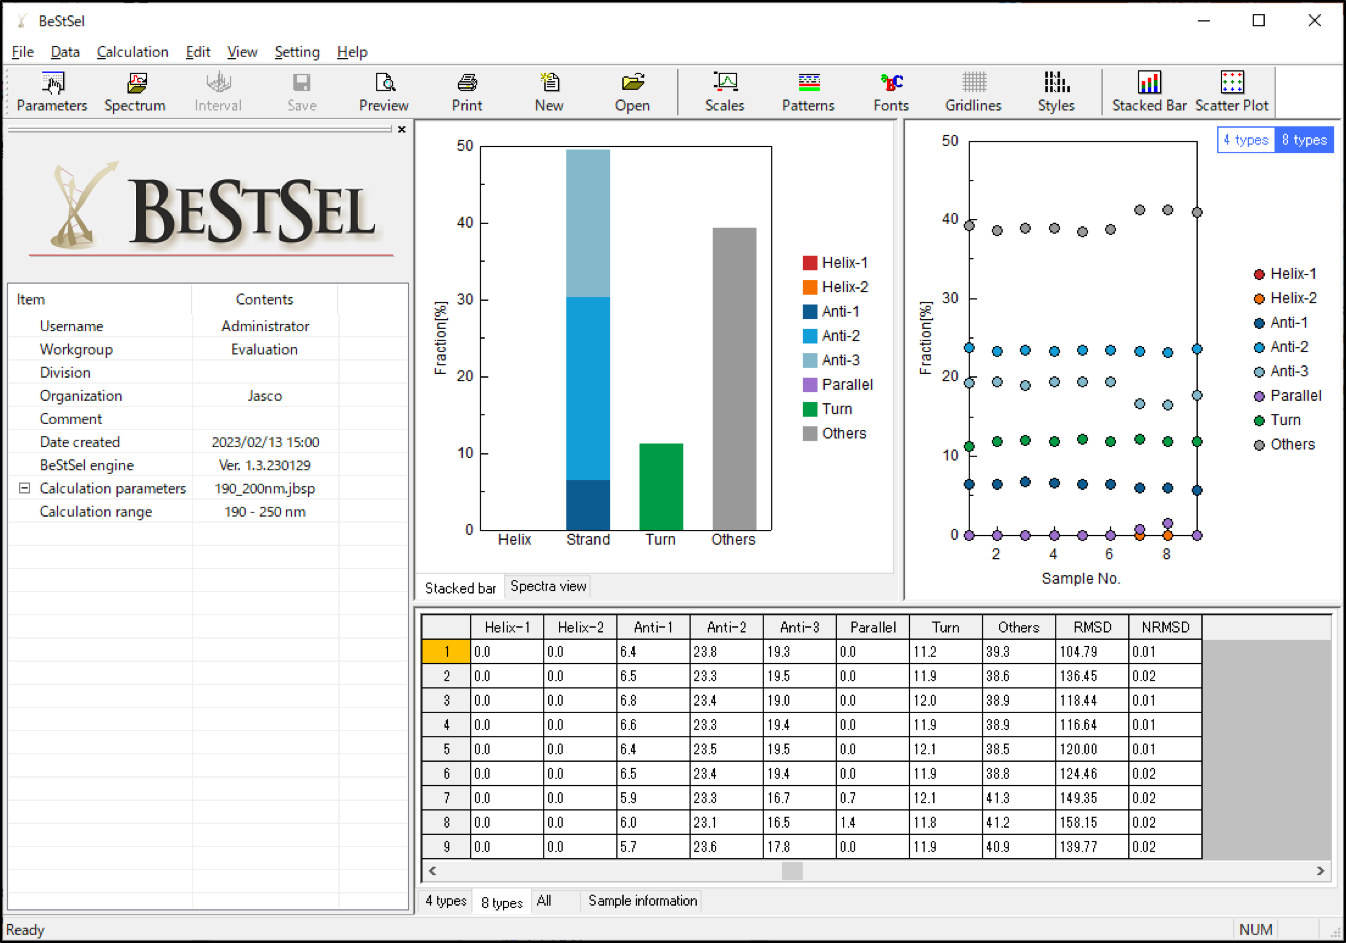
 Spectra Manager™ 2.5 BeStSel CFR
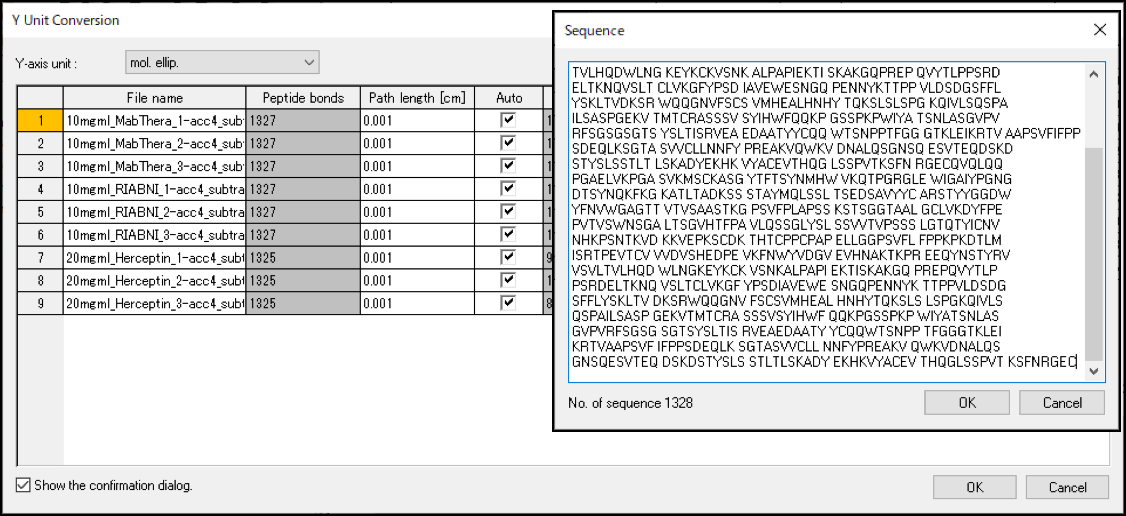
- Automated concentration calculation and spectrum conversion using protein sequence
- GxP compliant and satisfies computer system validation (CSV), electronic record/electronic signature (ER/ES), and data integrity (DI) principles for ALCOA+.
Materials
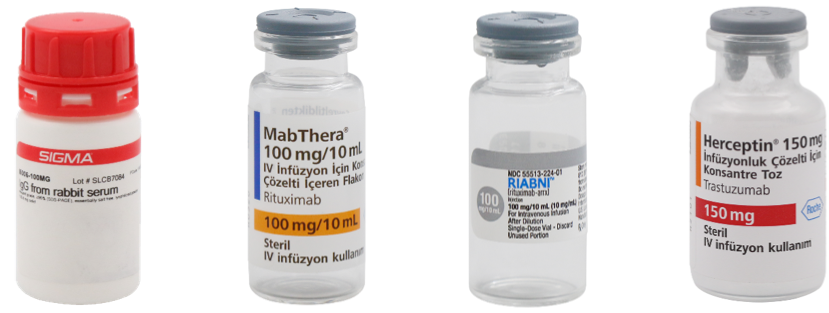
- IgG, from rabbit serum (Sigma Aldrich)
Powder dissolved in 20 mM citric acid buffer
(150 mM NaCl, pH 6.0) from 5.8 to 23.1 mg/mL - MabThera® (Rituximab, Roche) 10 mg/mL
- RIABNITM (Rituximab, AMGEN) 10 mg/mL
- Herceptin® (trastuzumab, Roche)
Powder dissolved in ultrapure water to 20 mg/mL
Methods
Table 1. Measurement Conditions
| CD | |||
| Bandwidth | 1.0 nm | Scan Speed | 50 nm/min |
| D.I.T. | 4 sec | Accumulations | 4 |
| FT/IR | |||
| Resolution | 4 cm-1 | Detector | TGS |
| Accumulation | 128 times | N2 purge | On |
Keywords
200-CD-0045
Results
First, we examined the validity of measuring highly concentrated samples using short-pathlength cells with IgG from rabbit serum. Figs. 1a and 1b show simultaneously measured CD and absorption spectra for various concentrations of IgG. The intensity of the raw CD spectra increases linearly with concentration. The MRE spectra are obtained from raw CD spectra normalized by concentration. Concentration calculation and subsequent conversion to MRE were also automatically conducted by Spectra Manager™ Ver.2.5 CFR BeStSel using a sequence of antibodies. The MRE spectra for each IgG concentration are consistent, and there is no change in the calculated secondary structure in this concentration range (Figs. 1c and 1e). The same samples were measured by FT/IR spectroscopy, which is an orthogonal method to CD, to verify the plausibility of the calculated secondary structure fractions (Fig. 1d). Secondary structure estimation (SSE) was performed for each concentration of antibody using the amide I peak at 1700-1600 cm-1. The secondary structure fractions calculated from the CD and FT/IR results show excellent agreement.
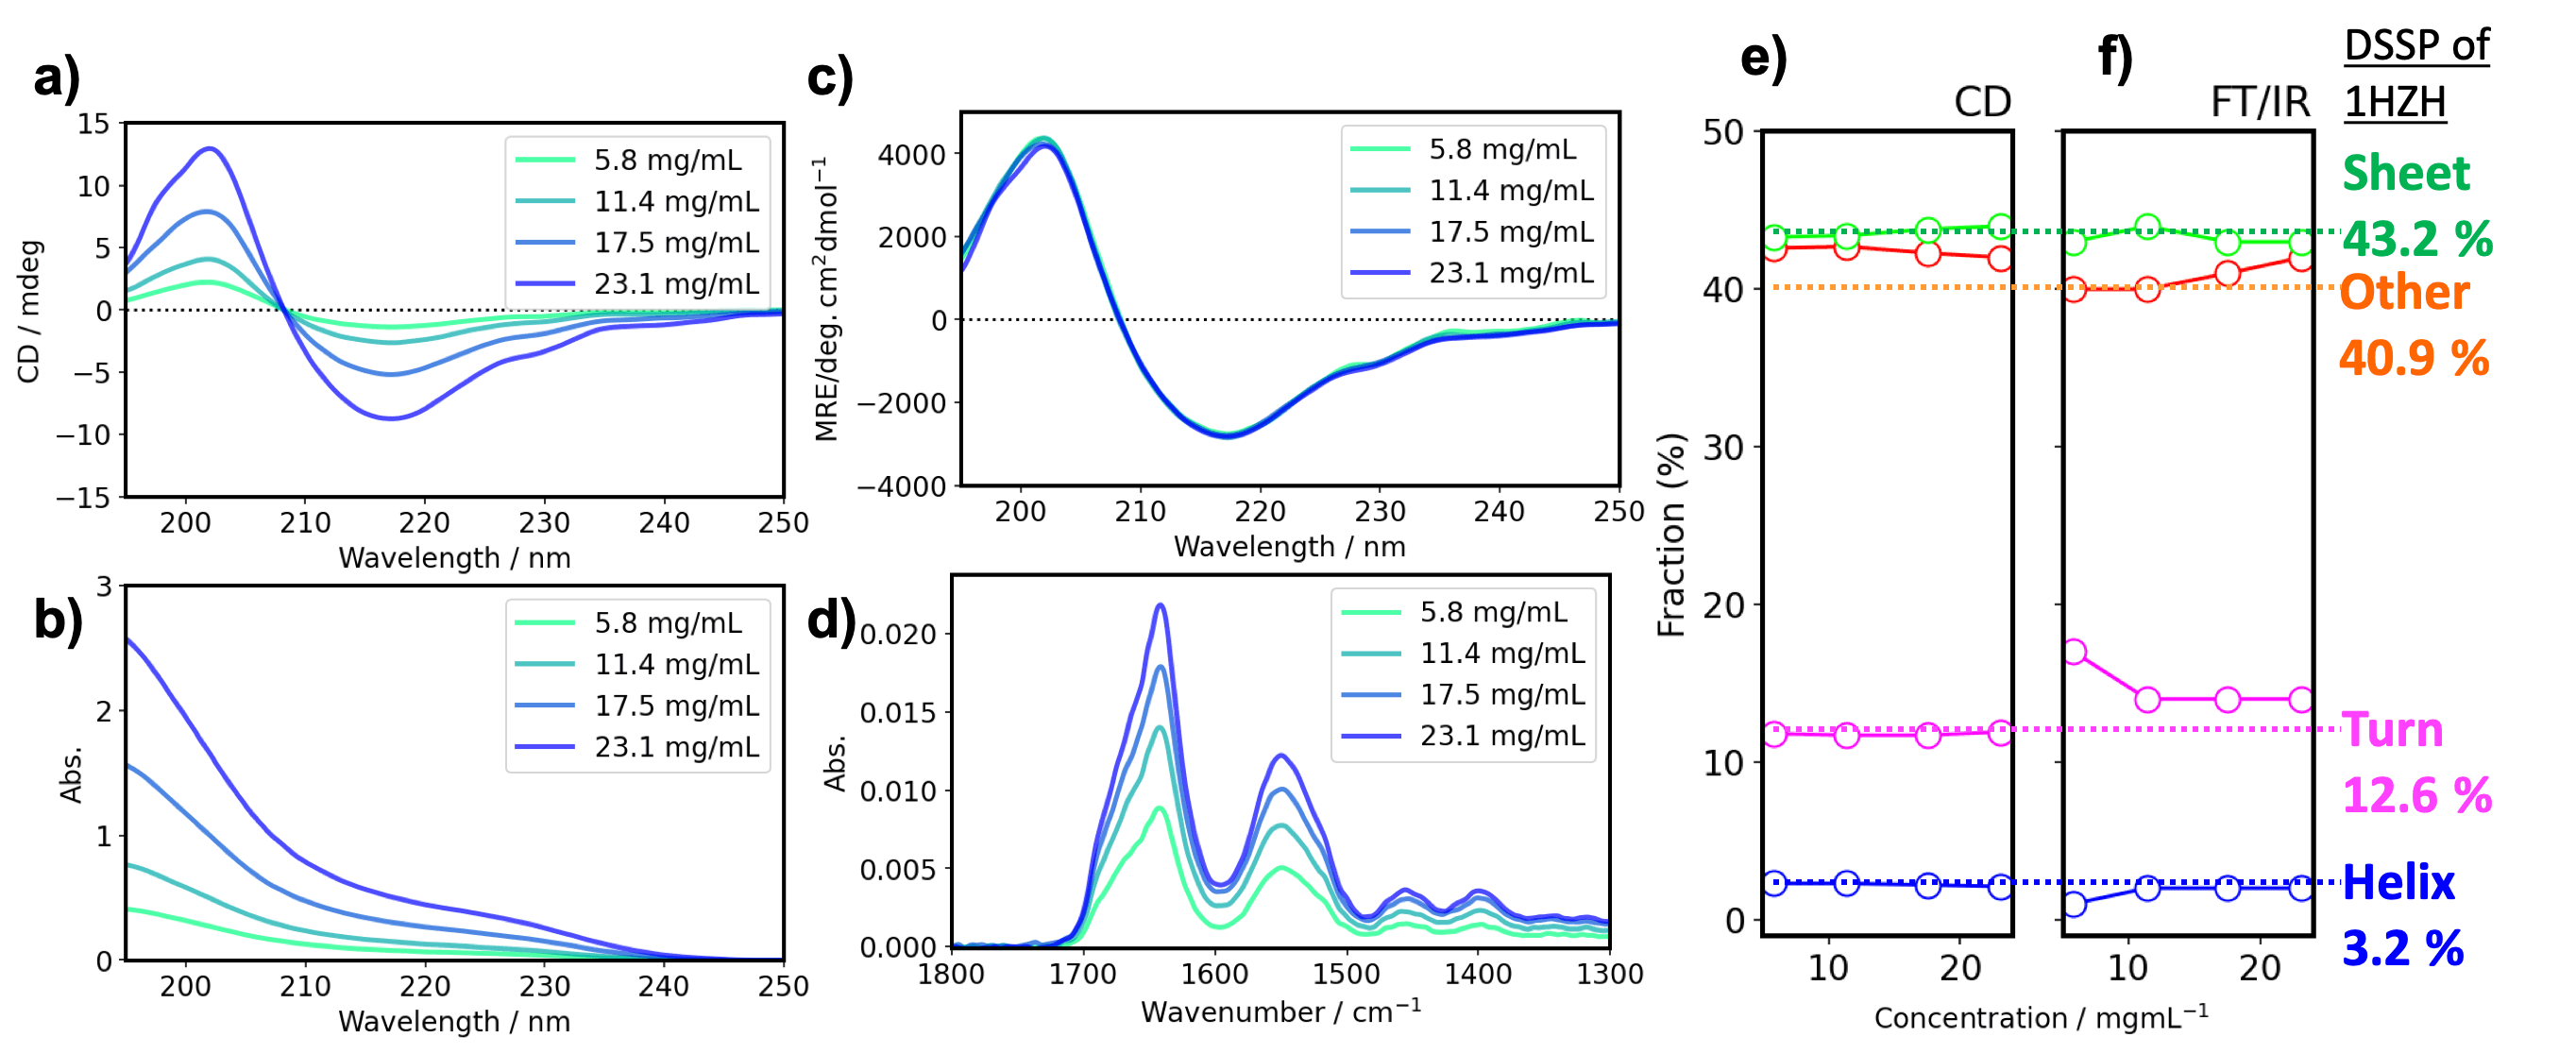
CD spectra, b) absorbance spectra, c) MRE spectra in far-UV region, and d) IR spectra of rabbit serum IgG.
e) and f) SSE results calculated using CD and FT/IR spectroscopy.
Having established a system to measure antibodies at high concentrations using a demountable cell, we then measured the actual antibody drug in its formulated (undiluted) form. The MRE spectra of each antibody drug are of very high quality even at short wavelengths (Fig. 2a). The standard deviation calculated from the results of three independent measurements is very small. The secondary structure fractions for MabThera® and RIABNITM are consistent within the standard deviation of the three measurements (Fig. 2b). The experimental and recalculated fitted spectra show excellent agreement, and the normalized root-mean-square deviation (NRMSD), which indicates spectral differences, is also very small (Fig. 2a).
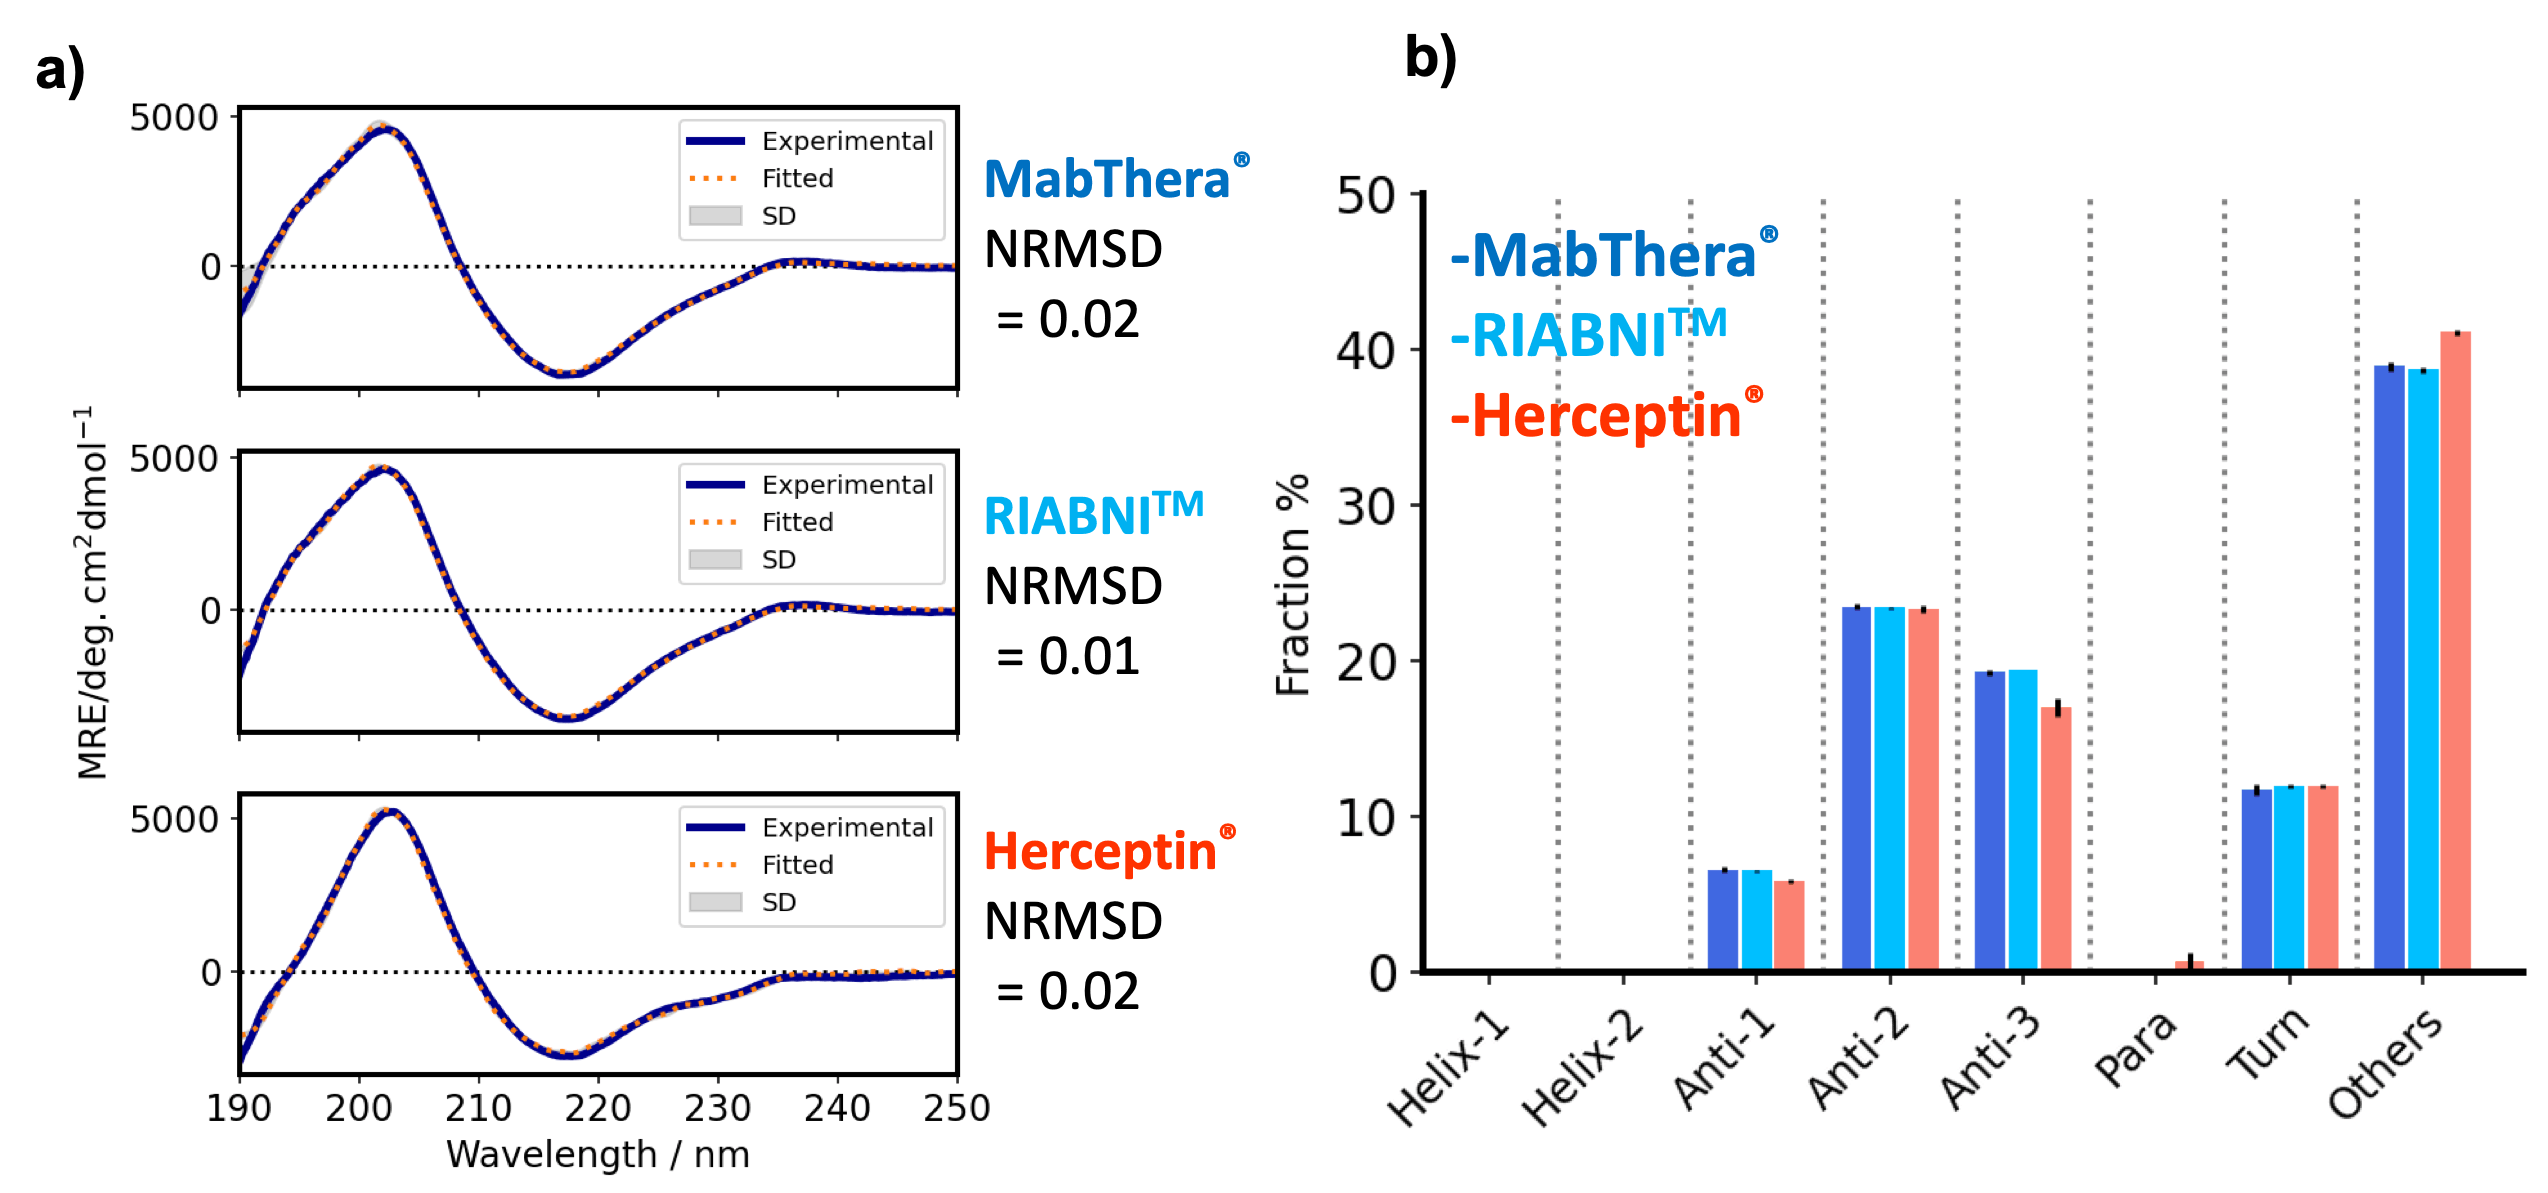
Mean of experimental spectra (solid line) and fitted spectra (dashed line) calculated using BeStSel are overlaid. The standard deviation was calculated from three independent measurements.
Fraction of secondary structure for each antibody drug. Error bars indicate the standard deviation calculated from three independent measurements.
The combination of a short pathlength (10 µm) cell and Spectra Manager™ Ver.2.5 CFR BeStSel with highly accurate absorbance data measured simultaneously by CD spectroscopy allowed us to evaluate the HOS of the antibody in its formulated state without dilution.
Conclusion
- J-1500 CD spectrometer and Spectra Manager™ 2.5 BeStSel CFR enable tracking of detailed structural changes in formulated antibody drugs.
- Spectra Manager™ 2.5 BeStSel CFR offers a GxP compliant environment and provides CSV, ER/ES, and DI, in compliance with ALCOA+ principles.
References
1) Ama, D., Hasegawa, J., Uchiyama, S., and Fukui, K. (2010). Netsu sokutei (Japan), 38, 9-15.
2) Micsonai, A., Wien, F., Kernya, L., Lee, Y. H., Goto, Y., Réfrégiers, M., & Kardos, J. (2015). Proc. Natl. Acad. Sci. U.S.A., 112, E3095–E3103.
3) Micsonai, A., Wien, F., Bulyáki, É., Kun, J., Moussong, É., Lee, Y. H., Goto, Y., Réfrégiers, M., & Kardos, J. (2018). Nucleic Acids Res., 46, W315-W322.
4) Micsonai, A., Bulyáki, É., & Kardos, J. (2021). Methods in molecular biology (Clifton, N.J.), 2199, 175–189.
5) Micsonai, A., Moussong, É., Lee, Y. H., Murvai, N., Tantos, Á., Tőke, O., Réfrégiers, M., Wien, F., & Kardos, J. (2022). Front. Mol. Biosci., 9.
6) Micsonai, A., Moussong, É., Wien, F., Boros, E., Vadászi, H., Murvai, N., Lee, Y. H., Molnár, T., Réfrégiers, M., Goto, Y., Tantos, Á., & Kardos, J. (2022). Nucleic Acids Res., 50, W90-W98.
AUTHORS
Satoko Suzuki1, Forrest R. Kohl2, Taiji Oyama1, Ai Yamane1, András Micsonai3, József Kardos3, Ken-ichi Akao1
1JASCO Corporation, Hachioji, Tokyo 192-8537, Japan, 2JASCO Inc., Easton, MD, USA, 3ELTE NAP Neuroimmunology Research Group, Department of Biochemistry, Institute of Biology, ELTE Eötvös Loránd University, Budapest H-1117, Hungary

Secondary Structure Estimation for Formulated Monoclonal Antibodies using JASCO Spectra Manager™ 2.5 BeStSel CFR
Introduction
Higher order structure (HOS) is an important physicochemical property of antibody drugs.1) The most well-known method for HOS characterization is circular dichroism (CD) spectroscopy. Although CD spectroscopy can provide robust structural information for low-concentration protein solutions (< ≈0.1 mg/mL), antibody drugs are formulated at concentrations higher than 10 mg/mL. Under these conditions, the antibody molecules can exhibit physicochemical properties that differ from those under dilute conditions. Fortunately, evaluation of high concentration solutions can be done via short CD path lengths (~10 mm) or using FTIR with ATR. The ability to perform structural characterization of antibodies without dilution is extremely important because intermolecular interactions and changes in the HOS can lead to the formation of aggregates that cause serious immunogenicity.
Secondary structure estimation offers a route to evaluate protein higher order structure, but historically has not worked well on proteins with high amounts of b-sheet such as antibodies. Recently, Micsonai et al. developed the BeStSel algorithm that can accurately estimate the secondary structure from a CD spectrum by taking into account parallel-antiparallel orientations of b-strands and the twist of antiparallel b-sheets. BeStSel has the following features: 1) high estimation accuracy for a wide range of proteins, including b-strand-rich proteins such as antibodies, 2) provides eight types of secondary structure information, 3) capability to predict protein folding following the CATH classification, and 4) open web server.2-6)
While many academic researchers use the BeStSel web server, researchers in biopharma companies who need to work in a GxP environment have not been able to benefit from BeStSel. To make BeStSel accessible to biopharma, we developed Spectra Manager™ Ver.2.5 CFR BeStSel as an add-in software for Spectra Manager™, a control and analysis platform for JASCO CD spectrometers, which is compatible with GxP.
Here, we describe an expanded application of CD spectroscopy for highly concentrated antibodies (undiluted) and report the results of a detailed secondary structure evaluation of antibody drugs using Spectra Manager™ Ver.2.5 CFR BeStSel.
Experimental
Measurement with J-1500 CD Spectrometer
- Simultaneous CD/absorbance measurements with high accuracy
- High throughput and high sensitivity
Short Pathlength Cuvette
- Optical pathlength: 10 µm
- Required sample volume: 6 µL
FT/IR-4X FTIR Spectrometer equipped with ATR PRO 4X
- High S/N ratio and resolution with compact size
- Proteins easily measured by placing one drop of sample on ATR PRO 4X
IR SSE-4X Secondary Structure Estimation Program
- SSE accuracy improved by addition of protein spectra to reference model
Spectra Manager™ 2.5 BeStSel CFR
- Automated concentration calculation and spectrum conversion using protein sequence
- GxP compliant and satisfies computer system validation (CSV), electronic record/electronic signature (ER/ES), and data integrity (DI) principles for ALCOA+.
Materials
- IgG, from rabbit serum (Sigma Aldrich)
Powder dissolved in 20 mM citric acid buffer
(150 mM NaCl, pH 6.0) from 5.8 to 23.1 mg/mL - MabThera® (Rituximab, Roche) 10 mg/mL
- RIABNITM (Rituximab, AMGEN) 10 mg/mL
- Herceptin® (trastuzumab, Roche)
Powder dissolved in ultrapure water to 20 mg/mL
Methods
Table 1. Measurement Conditions
| CD | |||
| Bandwidth | 1.0 nm | Scan Speed | 50 nm/min |
| D.I.T. | 4 sec | Accumulations | 4 |
| FT/IR | |||
| Resolution | 4 cm-1 | Detector | TGS |
| Accumulation | 128 times | N2 purge | On |
Results
First, we examined the validity of measuring highly concentrated samples using short-pathlength cells with IgG from rabbit serum. Figs. 1a and 1b show simultaneously measured CD and absorption spectra for various concentrations of IgG. The intensity of the raw CD spectra increases linearly with concentration. The MRE spectra are obtained from raw CD spectra normalized by concentration. Concentration calculation and subsequent conversion to MRE were also automatically conducted by Spectra Manager™ Ver.2.5 CFR BeStSel using a sequence of antibodies. The MRE spectra for each IgG concentration are consistent, and there is no change in the calculated secondary structure in this concentration range (Figs. 1c and 1e). The same samples were measured by FT/IR spectroscopy, which is an orthogonal method to CD, to verify the plausibility of the calculated secondary structure fractions (Fig. 1d). Secondary structure estimation (SSE) was performed for each concentration of antibody using the amide I peak at 1700-1600 cm-1. The secondary structure fractions calculated from the CD and FT/IR results show excellent agreement.
CD spectra, b) absorbance spectra, c) MRE spectra in far-UV region, and d) IR spectra of rabbit serum IgG.
e) and f) SSE results calculated using CD and FT/IR spectroscopy.
Having established a system to measure antibodies at high concentrations using a demountable cell, we then measured the actual antibody drug in its formulated (undiluted) form. The MRE spectra of each antibody drug are of very high quality even at short wavelengths (Fig. 2a). The standard deviation calculated from the results of three independent measurements is very small. The secondary structure fractions for MabThera® and RIABNITM are consistent within the standard deviation of the three measurements (Fig. 2b). The experimental and recalculated fitted spectra show excellent agreement, and the normalized root-mean-square deviation (NRMSD), which indicates spectral differences, is also very small (Fig. 2a).
Mean of experimental spectra (solid line) and fitted spectra (dashed line) calculated using BeStSel are overlaid. The standard deviation was calculated from three independent measurements.
Fraction of secondary structure for each antibody drug. Error bars indicate the standard deviation calculated from three independent measurements.
The combination of a short pathlength (10 µm) cell and Spectra Manager™ Ver.2.5 CFR BeStSel with highly accurate absorbance data measured simultaneously by CD spectroscopy allowed us to evaluate the HOS of the antibody in its formulated state without dilution.
Conclusion
- J-1500 CD spectrometer and Spectra Manager™ 2.5 BeStSel CFR enable tracking of detailed structural changes in formulated antibody drugs.
- Spectra Manager™ 2.5 BeStSel CFR offers a GxP compliant environment and provides CSV, ER/ES, and DI, in compliance with ALCOA+ principles.
Keywords
200-CD-0045
References
1) Ama, D., Hasegawa, J., Uchiyama, S., and Fukui, K. (2010). Netsu sokutei (Japan), 38, 9-15.
2) Micsonai, A., Wien, F., Kernya, L., Lee, Y. H., Goto, Y., Réfrégiers, M., & Kardos, J. (2015). Proc. Natl. Acad. Sci. U.S.A., 112, E3095–E3103.
3) Micsonai, A., Wien, F., Bulyáki, É., Kun, J., Moussong, É., Lee, Y. H., Goto, Y., Réfrégiers, M., & Kardos, J. (2018). Nucleic Acids Res., 46, W315-W322.
4) Micsonai, A., Bulyáki, É., & Kardos, J. (2021). Methods in molecular biology (Clifton, N.J.), 2199, 175–189.
5) Micsonai, A., Moussong, É., Lee, Y. H., Murvai, N., Tantos, Á., Tőke, O., Réfrégiers, M., Wien, F., & Kardos, J. (2022). Front. Mol. Biosci., 9.
6) Micsonai, A., Moussong, É., Wien, F., Boros, E., Vadászi, H., Murvai, N., Lee, Y. H., Molnár, T., Réfrégiers, M., Goto, Y., Tantos, Á., & Kardos, J. (2022). Nucleic Acids Res., 50, W90-W98.
AUTHORS
Satoko Suzuki1, Forrest R. Kohl2, Taiji Oyama1, Ai Yamane1, András Micsonai3, József Kardos3, Ken-ichi Akao1
1JASCO Corporation, Hachioji, Tokyo 192-8537, Japan, 2JASCO Inc., Easton, MD, USA, 3ELTE NAP Neuroimmunology Research Group, Department of Biochemistry, Institute of Biology, ELTE Eötvös Loránd University, Budapest H-1117, Hungary