Simultaneous Monitoring Analysis of Multicomponent Gases in the Atmosphere using CLS Quantitation
May 2, 2024
 Download This Application
Introduction
Typical quantitation models use either the height or area of a single peak. CLS (Classical Least Square) quantitation is
a multivariate analysis model that uses the area in the entire spectral data, which is dependent on the concentration. Therefore, CLS is an effective quantitation method where it is difficult to find a single peak for quantitation because of overlaid spectra of multi-components, and simultaneous quantitation of multi-component is required. The advantages of CLS quantitation are shown below. First, higher accuracy is expected because the entire wavenumber region is used for the quantitation calculation and the residual noise level is reduced. Second, pure spectra of each compound can be obtained using CLS. So, it is easier to analyze multi-components accurately.
Experimental
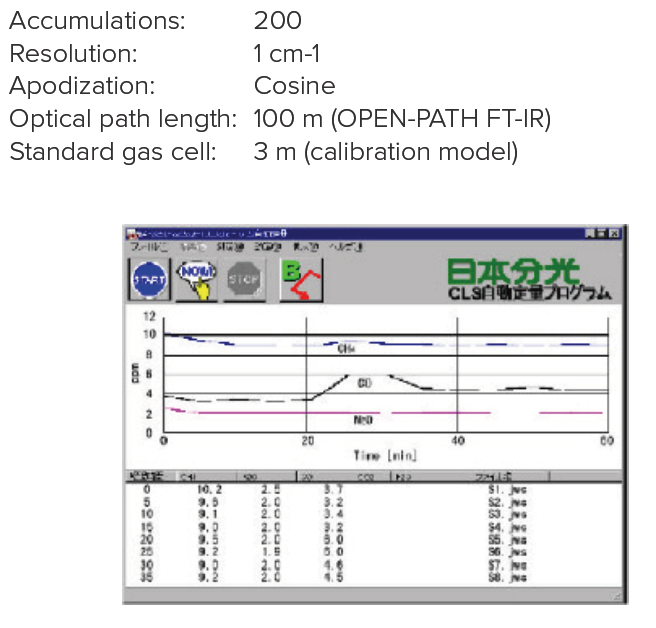
The average concentrations of 5 components of gases (CH4, N2O, CO, CO2 and H2O) in the atmosphere were repeatedly monitored using the OPEN-PATH FTIR system with an optical path length of 100m. Figure 1 shows the quantitation results obtained using CLS calibration curves prepared in advance, for specified periods (5 min) for each component, which are shown as time-course data. The concentration change during the time-course is shown.
Keywords
230-QU-0175, Open Path Gas Measurement, CLS, Classical Least Squares, Methane, Nitrous Oxide, Carbon Monoxide, Carbon Dioxide, Water, H20, N20, CO2, CO, CH4,
Results
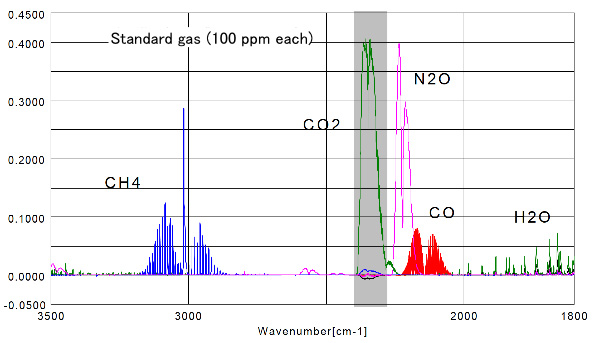
Figure 2 Results for each standard gas (100 ppm) in a standard gas cell (3m). The absorption spectra of the following gases CO, CO2 and N2O are overlapped. To determine the detection limits, from a concentration of 100 ppm of N2O gas corresponding to an absorbance 0.400, it can be extrapolated that a concentration of 1 ppm, has 0.004 ABS, it is estimated that quantitation to a concentration <1 ppm is possible.
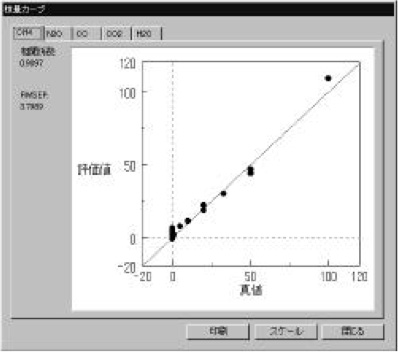
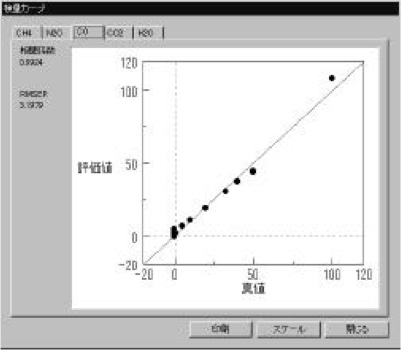
Figure 3 Calibration models (CH4 and CO gas) were measured using a standard gas cell (3m). The calibration curves show good linearity in the range of 1-120 ppm. The correlation coefficient is better than 0.98. Calibration models for CO2, N2O and H2O gas were also created (not shown). The optical path difference is corrected automatically in the measurement using the [OPEN-PATH FTIR].
Featured Products:


Simultaneous Monitoring Analysis of Multicomponent Gases in the Atmosphere using CLS Quantitation
Introduction
Typical quantitation models use either the height or area of a single peak. CLS (Classical Least Square) quantitation is
a multivariate analysis model that uses the area in the entire spectral data, which is dependent on the concentration. Therefore, CLS is an effective quantitation method where it is difficult to find a single peak for quantitation because of overlaid spectra of multi-components, and simultaneous quantitation of multi-component is required. The advantages of CLS quantitation are shown below. First, higher accuracy is expected because the entire wavenumber region is used for the quantitation calculation and the residual noise level is reduced. Second, pure spectra of each compound can be obtained using CLS. So, it is easier to analyze multi-components accurately.
Experimental
The average concentrations of 5 components of gases (CH4, N2O, CO, CO2 and H2O) in the atmosphere were repeatedly monitored using the OPEN-PATH FTIR system with an optical path length of 100m. Figure 1 shows the quantitation results obtained using CLS calibration curves prepared in advance, for specified periods (5 min) for each component, which are shown as time-course data. The concentration change during the time-course is shown.
Results
Figure 2 Results for each standard gas (100 ppm) in a standard gas cell (3m). The absorption spectra of the following gases CO, CO2 and N2O are overlapped. To determine the detection limits, from a concentration of 100 ppm of N2O gas corresponding to an absorbance 0.400, it can be extrapolated that a concentration of 1 ppm, has 0.004 ABS, it is estimated that quantitation to a concentration <1 ppm is possible.
Figure 3 Calibration models (CH4 and CO gas) were measured using a standard gas cell (3m). The calibration curves show good linearity in the range of 1-120 ppm. The correlation coefficient is better than 0.98. Calibration models for CO2, N2O and H2O gas were also created (not shown). The optical path difference is corrected automatically in the measurement using the [OPEN-PATH FTIR].
Keywords
230-QU-0175, Open Path Gas Measurement, CLS, Classical Least Squares, Methane, Nitrous Oxide, Carbon Monoxide, Carbon Dioxide, Water, H20, N20, CO2, CO, CH4,