Stability Evaluation of Anti-Corona Virus VHH Antibody using Circular Dichroism Spectroscopy
January 5, 2024
 Download This Application
Introduction
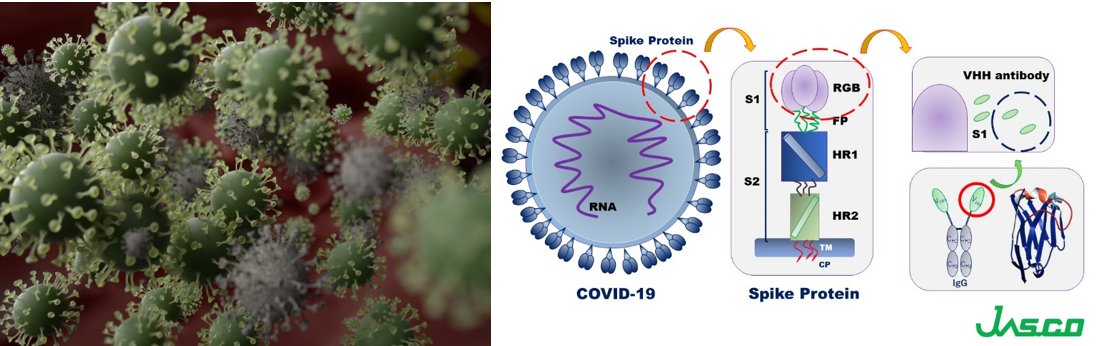
The coronavirus S glycoproteins sit on the surface of the virus particle (Figure 1) and facilitates receptor binding and membrane fusion, which leads to entry of the virus into host cells. Therefore, the S proteins are the main target for neutralizing binding and therapeutic drug design.
VHH antibodies are small, single domain antibodies corresponding to the variable region of a heavy chain camelid antibody (Figure 1). They are highly stable with respect to heat, have high affinity and binding specificity, a low molecular weight which increases mass production efficiency, and can be easily modified. Since the structure of antibody drugs may change and cause a loss in their activity depending on the formulation conditions and storage environment, it is necessary to evaluate their stability in order to ensure quality. In particular, thermal denaturation is highly reversible depending on the protein, increasing the need to determine denaturation temperature and refolding ability in the stability evaluation of antibody drugs.
Here, we evaluate the thermal stability and refolding ability of 3 different types of VHH antibodies using a J-1500 CD spectrometer. The secondary structure percentages were estimated using the BeStSel program to further correlate the denaturation temperatures with structural changes to VHH antibody framework.
 Measurement System
J-1500 Circular Dichroism Spectropolarimeter
MPTC-513 Multiple-Position Peltier Cell Changers
JWTDA-519 Denatured Protein Analysis Program
BeStSel Beta Structure Selection Program
Cuvette CD cell
Experimental
Antibody denaturation study
The denaturation curve of the VHH antibody was obtained by heating the sample temperature from 25 to 90°C while measuring the CD value at 217 nm, indicative of b-sheet structure. The starting temperature, onset temperature (To), denaturation temperature (Tm), and end temperature (Te) were calculated from the obtained denaturation curves.
| Thermal Denaturation Measurement Conditions | |||
| Wavelength | 217 nm | Bandwidth | 1 nm |
| D.I.T. | 2 sec | Temperature Interval | 1°C |
| Temperature Gradient | 1°C/min | Temperature Range | 25 - 90°C |
Secondary structure changes due to refolding
The CD value at 217 nm was measured from 25°C to the end temperature (Te) obtained from the denaturation curves, and then cooled back to 25°C. CD spectra were measured at the start temperature, onset (To), denaturation temperature (Tm), and end temperature (Te). Secondary structure analysis was performed on the obtained CD spectra using BeStSel and the refolding ability was calculated from the amount of change in the β-sheet structure at 25°C.
| Secondary Structure Refolding Measurement Conditions | |||
| Wavelength | 217 nm | Bandwidth | 1 nm |
| D.I.T. | 4 sec | Temperature Interval | 1°C |
| Temperature Gradient | 1°C/min | Temperature Range | 25 - 75°C (Samples 1 and 2) 25 - 80°C (Sample 3) |
| Spectra Measurement Conditions | |||
| Wavelength | 250 - 200 nm | Bandwidth | 1 nm |
| D.I.T. | 4 sec | Scanning Speed | 50 nm/min |
| Temperature Gradient | 0.1 nm | Accumulations | 9 |
![]() BeStSel (http://bestsel.elte.hu/) is a secondary structure analysis program developed by Dr. József Kardos of ELTE Eötvös Loránd University 1, 2). The algorithm deconvolutes β–sheet structure into four substructures, taking into account the twist between b-strands. This enables highly accurate secondary structure analysis of b -sheet-rich proteins like protein aggregates such as amyloid fibrils and IgG. Therefore, BeStSel was used in this study for the secondary structure analysis of VHH antibodies
BeStSel (http://bestsel.elte.hu/) is a secondary structure analysis program developed by Dr. József Kardos of ELTE Eötvös Loránd University 1, 2). The algorithm deconvolutes β–sheet structure into four substructures, taking into account the twist between b-strands. This enables highly accurate secondary structure analysis of b -sheet-rich proteins like protein aggregates such as amyloid fibrils and IgG. Therefore, BeStSel was used in this study for the secondary structure analysis of VHH antibodies
Keywords
200-CD-0035, SARS-CoV-2, Corona Virus, Antibody drugs, VHH, Refolding, Onset, Denaturation temperature, Secondary structure, BestSel, Circular Dichroism
Results
Antibody denaturation study
Figure 2 shows the denaturation curve of the CD at 217 nm which reflects changes in β-sheet structure. Table 1 shows the onset (To), denaturation temperature (Tm), and end temperature (Te) obtained from the denaturation curve. Comparing the denaturation temperatures, it can be seen that the thermal stability of the samples decreasing in the following order: Sample 3, 1, and 2.
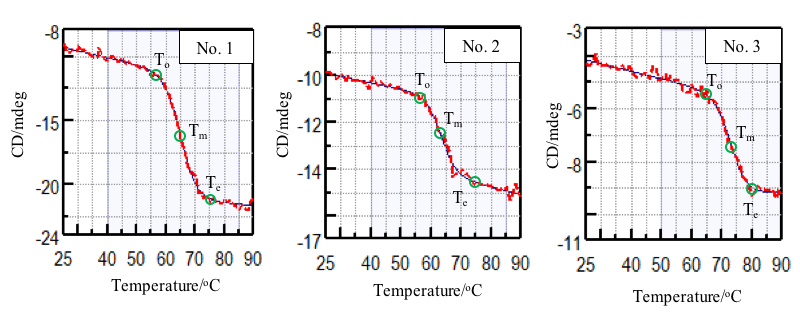
Table 1 Analysis results of onset temperature (To), denaturation temperature (Tm), and end temperature (Te).
| Sample | To(°C) | Tm(°C) | Te(°C) |
| No. 1 | 57 | 65 | 75 |
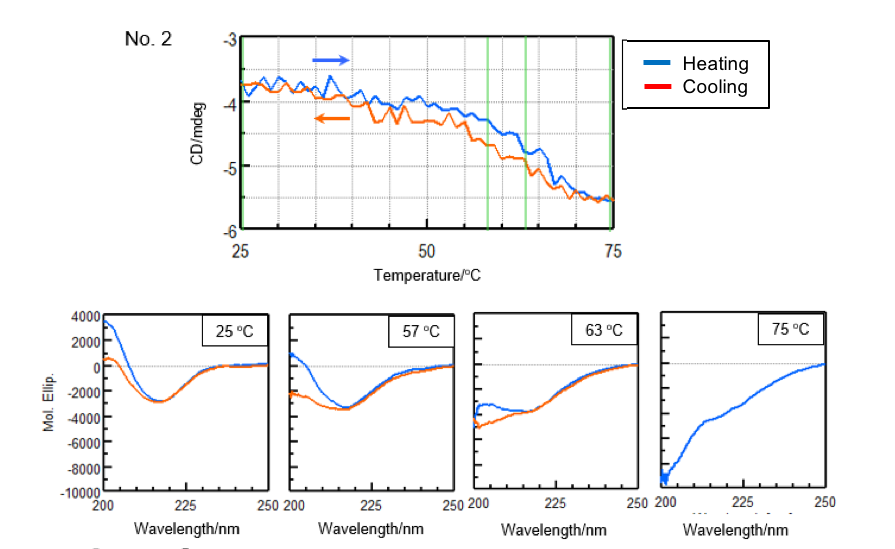
| No. 2 | 57 | 63 | 75 |
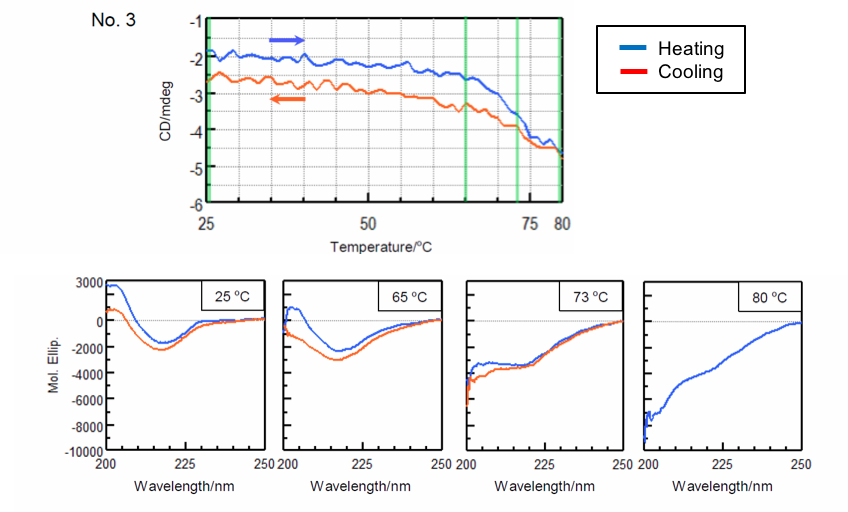
| No. 3 | 65 | 73 | 80 |
Secondary structure changes due to refolding
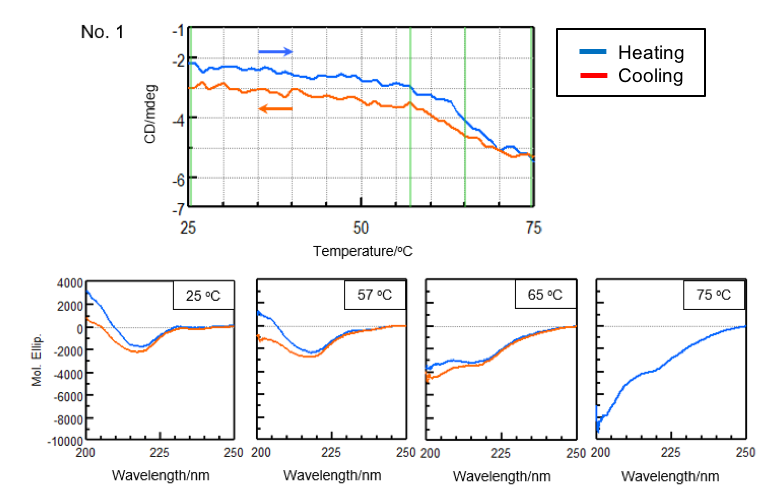
In order to reduce the effect of aggregation, the sample was heated to the end temperature (Te) determined from the previously obtained denaturation curves and cooled immediately after the sample denatured. Figure 3 shows the denaturation and refolding curves at 217 nm and the CD spectra at the samples’ respective start temperature, onset temperature (To), denaturation temperature (Tm), and end temperature (Te).
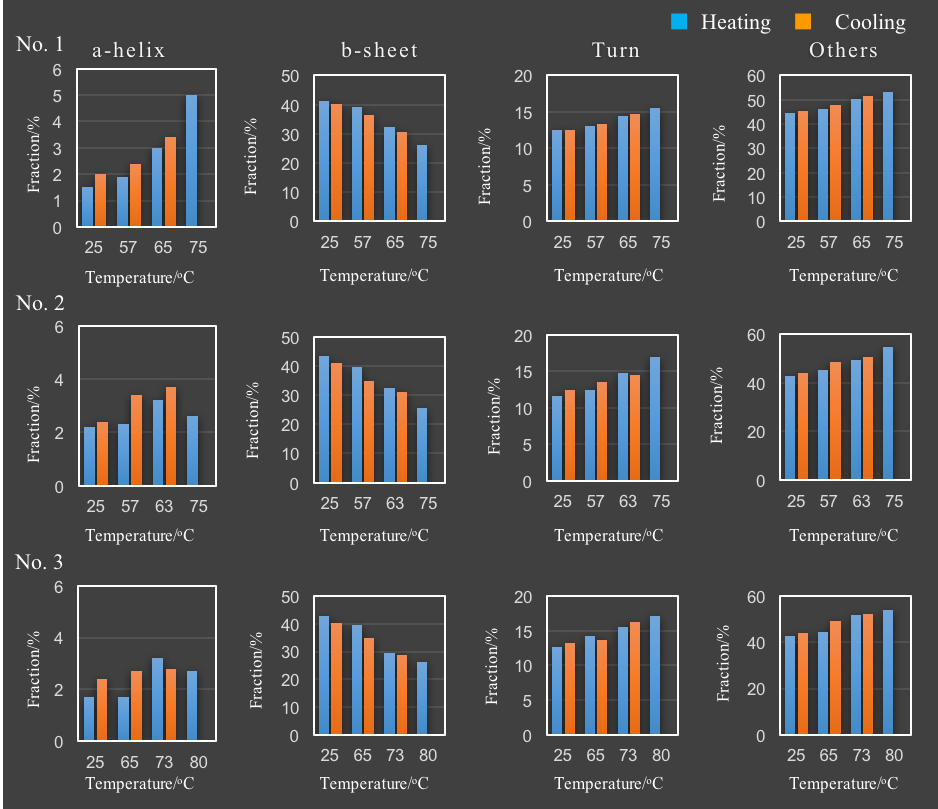
Table 2 and Figure 4 show the result of the secondary structure analysis by using BeStSel.
Table 2. Secondary structure analysis results calculated using the BeStSel program.
| Number 1 | ||||
| Temperature (°C) | α-helical (%) | β-sheet (%) | Turn (%) | Others* (%) |
| 25 | 1.5 | 41.3 | 12.5 | 44.6 |
| 57 | 1.9 | 39.1 | 13.0 | 46.0 |
| 65 | 3.0 | 32.1 | 14.5 | 50.2 |
| 75 | 5.0 | 26.3 | 15.6 | 53.1 |
| 65 | 3.4 | 30.6 | 14.7 | 51.4 |
| 57 | 2.4 | 36.4 | 12.5 | 45.3 |
| 25 | 2.0 | 40.2 | 12.5 | 45.3 |
| *3,10-helix, π-helix, β-bridge, bend, loop/irregular, invisible regions of the structure |
||||
| Number 2 | ||||
| Temperature (°C) | α-helical (%) | β-sheet (%) | Turn (%) | Others* (%) |
| 25 | 2.2 | 43.6 | 11.6 | 42.7 |
| 57 | 2.3 | 39.8 | 12.4 | 45.4 |
| 65 | 3.2 | 32.6 | 14.8 | 49.4 |
| 75 | 2.6 | 25.6 | 17.0 | 54.8 |
| 65 | 3.7 | 31.2 | 14.5 | 50.6 |
| 57 | 3.4 | 34.8 | 13.5 | 48.4 |
| 25 | 2.4 | 41.4 | 12.4 | 44.1 |
| Number 3 | ||||
| Temperature (°C) | α-helical (%) | β-sheet (%) | Turn (%) | Others* (%) |
| 25 | 1.7 | 42.9 | 12.7 | 42.6 |
| 65 | 1.7 | 39.6 | 14.2 | 44.4 |
| 73 | 3.2 | 29.4 | 15.6 | 51.8 |
| 80 | 2.7 | 26.4 | 17.1 | 53.8 |
| 73 | 2.8 | 28.8 | 16.2 | 52.2 |
| 65 | 2.7 | 34.7 | 13.6 | 49.0 |
| 25 | 2.4 | 40.1 | 13.2 | 44.2 |
Conclusion
The results show that for all samples β-sheet structure decreases, with the proportion of turn and other structures increasing with increased temperature. In addition, the proportion of α-helix increases with increased temperature for sample No.1 only. The thermal reversibility study indicates that the β-sheet, turn, and other structures in all three samples are reversible, as well as the α-helix structure of No.1 sample. While the framework of VHH antibodies is considered to be conserved, the structure of the complementarity determining regions (CDR) that bind to the antigens is variable. The framework is primarily composed of β-sheet structure and any changes in structure can potentially affect the structure of the CDR. Focusing on the percentage of β-sheet secondary structure, the effective refolding before and after heating was calculated for samples No.1, No.2 and No.3 and were 97.3%, 95.0% 93.5%, respectively. Therefore the ability of the samples to refold after heating and cooling assumes the following order, No.1, No.2 and No.3, further supporting the melting temperature data obtained in Figure 2.
References
1) A. Micsonai, F. Wien, L. Kernya, Y.H. Lee, Y. Goto, M. Refregiers, J. Kardos, Accurate secondary structure prediction and fold recognition for circular dichroism spectroscopy, PNAS.112 (2015) 3095-3103.
2) A. Micsonai, F. Wien, E. Bulyaki, J. Kun, E. Moussong, Y.H. Lee, Y. Goto, M. Refregiers, J. Kardos, BeStSel: a web server for accurate protein secondary structure prediction and fold recognition from the circular dichroism spectra, Nucleic Acids Res.46 (2018) 315-322.
Featured Products:

Stability Evaluation of Anti-Corona Virus VHH Antibody using Circular Dichroism Spectroscopy
Introduction
The coronavirus S glycoproteins sit on the surface of the virus particle (Figure 1) and facilitates receptor binding and membrane fusion, which leads to entry of the virus into host cells. Therefore, the S proteins are the main target for neutralizing binding and therapeutic drug design.
VHH antibodies are small, single domain antibodies corresponding to the variable region of a heavy chain camelid antibody (Figure 1). They are highly stable with respect to heat, have high affinity and binding specificity, a low molecular weight which increases mass production efficiency, and can be easily modified. Since the structure of antibody drugs may change and cause a loss in their activity depending on the formulation conditions and storage environment, it is necessary to evaluate their stability in order to ensure quality. In particular, thermal denaturation is highly reversible depending on the protein, increasing the need to determine denaturation temperature and refolding ability in the stability evaluation of antibody drugs.
Here, we evaluate the thermal stability and refolding ability of 3 different types of VHH antibodies using a J-1500 CD spectrometer. The secondary structure percentages were estimated using the BeStSel program to further correlate the denaturation temperatures with structural changes to VHH antibody framework.
Measurement System
J-1500 Circular Dichroism Spectropolarimeter
MPTC-513 Multiple-Position Peltier Cell Changers
JWTDA-519 Denatured Protein Analysis Program
BeStSel Beta Structure Selection Program
Cuvette CD cell
Experimental
Antibody denaturation study
The denaturation curve of the VHH antibody was obtained by heating the sample temperature from 25 to 90°C while measuring the CD value at 217 nm, indicative of b-sheet structure. The starting temperature, onset temperature (To), denaturation temperature (Tm), and end temperature (Te) were calculated from the obtained denaturation curves.
| Thermal Denaturation Measurement Conditions | |||
| Wavelength | 217 nm | Bandwidth | 1 nm |
| D.I.T. | 2 sec | Temperature Interval | 1°C |
| Temperature Gradient | 1°C/min | Temperature Range | 25 - 90°C |
Secondary structure changes due to refolding
The CD value at 217 nm was measured from 25°C to the end temperature (Te) obtained from the denaturation curves, and then cooled back to 25°C. CD spectra were measured at the start temperature, onset (To), denaturation temperature (Tm), and end temperature (Te). Secondary structure analysis was performed on the obtained CD spectra using BeStSel and the refolding ability was calculated from the amount of change in the β-sheet structure at 25°C.
| Secondary Structure Refolding Measurement Conditions | |||
| Wavelength | 217 nm | Bandwidth | 1 nm |
| D.I.T. | 4 sec | Temperature Interval | 1°C |
| Temperature Gradient | 1°C/min | Temperature Range | 25 - 75°C (Samples 1 and 2) 25 - 80°C (Sample 3) |
| Spectra Measurement Conditions | |||
| Wavelength | 250 - 200 nm | Bandwidth | 1 nm |
| D.I.T. | 4 sec | Scanning Speed | 50 nm/min |
| Temperature Gradient | 0.1 nm | Accumulations | 9 |
![]() BeStSel (http://bestsel.elte.hu/) is a secondary structure analysis program developed by Dr. József Kardos of ELTE Eötvös Loránd University 1, 2). The algorithm deconvolutes β–sheet structure into four substructures, taking into account the twist between b-strands. This enables highly accurate secondary structure analysis of b -sheet-rich proteins like protein aggregates such as amyloid fibrils and IgG. Therefore, BeStSel was used in this study for the secondary structure analysis of VHH antibodies
BeStSel (http://bestsel.elte.hu/) is a secondary structure analysis program developed by Dr. József Kardos of ELTE Eötvös Loránd University 1, 2). The algorithm deconvolutes β–sheet structure into four substructures, taking into account the twist between b-strands. This enables highly accurate secondary structure analysis of b -sheet-rich proteins like protein aggregates such as amyloid fibrils and IgG. Therefore, BeStSel was used in this study for the secondary structure analysis of VHH antibodies
Results
Antibody denaturation study
Figure 2 shows the denaturation curve of the CD at 217 nm which reflects changes in β-sheet structure. Table 1 shows the onset (To), denaturation temperature (Tm), and end temperature (Te) obtained from the denaturation curve. Comparing the denaturation temperatures, it can be seen that the thermal stability of the samples decreasing in the following order: Sample 3, 1, and 2.
Table 1 Analysis results of onset temperature (To), denaturation temperature (Tm), and end temperature (Te).
| Sample | To(°C) | Tm(°C) | Te(°C) |
| No. 1 | 57 | 65 | 75 |
| No. 2 | 57 | 63 | 75 |
| No. 3 | 65 | 73 | 80 |
Secondary structure changes due to refolding
In order to reduce the effect of aggregation, the sample was heated to the end temperature (Te) determined from the previously obtained denaturation curves and cooled immediately after the sample denatured. Figure 3 shows the denaturation and refolding curves at 217 nm and the CD spectra at the samples’ respective start temperature, onset temperature (To), denaturation temperature (Tm), and end temperature (Te).
Table 2 and Figure 4 show the result of the secondary structure analysis by using BeStSel.
Table 2. Secondary structure analysis results calculated using the BeStSel program.
| Number 1 | ||||
| Temperature (°C) | α-helical (%) | β-sheet (%) | Turn (%) | Others* (%) |
| 25 | 1.5 | 41.3 | 12.5 | 44.6 |
| 57 | 1.9 | 39.1 | 13.0 | 46.0 |
| 65 | 3.0 | 32.1 | 14.5 | 50.2 |
| 75 | 5.0 | 26.3 | 15.6 | 53.1 |
| 65 | 3.4 | 30.6 | 14.7 | 51.4 |
| 57 | 2.4 | 36.4 | 12.5 | 45.3 |
| 25 | 2.0 | 40.2 | 12.5 | 45.3 |
| *3,10-helix, π-helix, β-bridge, bend, loop/irregular, invisible regions of the structure |
||||
| Number 2 | ||||
| Temperature (°C) | α-helical (%) | β-sheet (%) | Turn (%) | Others* (%) |
| 25 | 2.2 | 43.6 | 11.6 | 42.7 |
| 57 | 2.3 | 39.8 | 12.4 | 45.4 |
| 65 | 3.2 | 32.6 | 14.8 | 49.4 |
| 75 | 2.6 | 25.6 | 17.0 | 54.8 |
| 65 | 3.7 | 31.2 | 14.5 | 50.6 |
| 57 | 3.4 | 34.8 | 13.5 | 48.4 |
| 25 | 2.4 | 41.4 | 12.4 | 44.1 |
| Number 3 | ||||
| Temperature (°C) | α-helical (%) | β-sheet (%) | Turn (%) | Others* (%) |
| 25 | 1.7 | 42.9 | 12.7 | 42.6 |
| 65 | 1.7 | 39.6 | 14.2 | 44.4 |
| 73 | 3.2 | 29.4 | 15.6 | 51.8 |
| 80 | 2.7 | 26.4 | 17.1 | 53.8 |
| 73 | 2.8 | 28.8 | 16.2 | 52.2 |
| 65 | 2.7 | 34.7 | 13.6 | 49.0 |
| 25 | 2.4 | 40.1 | 13.2 | 44.2 |
Conclusion
The results show that for all samples β-sheet structure decreases, with the proportion of turn and other structures increasing with increased temperature. In addition, the proportion of α-helix increases with increased temperature for sample No.1 only. The thermal reversibility study indicates that the β-sheet, turn, and other structures in all three samples are reversible, as well as the α-helix structure of No.1 sample. While the framework of VHH antibodies is considered to be conserved, the structure of the complementarity determining regions (CDR) that bind to the antigens is variable. The framework is primarily composed of β-sheet structure and any changes in structure can potentially affect the structure of the CDR. Focusing on the percentage of β-sheet secondary structure, the effective refolding before and after heating was calculated for samples No.1, No.2 and No.3 and were 97.3%, 95.0% 93.5%, respectively. Therefore the ability of the samples to refold after heating and cooling assumes the following order, No.1, No.2 and No.3, further supporting the melting temperature data obtained in Figure 2.
Keywords
200-CD-0035, SARS-CoV-2, Corona Virus, Antibody drugs, VHH, Refolding, Onset, Denaturation temperature, Secondary structure, BestSel, Circular Dichroism
References
1) A. Micsonai, F. Wien, L. Kernya, Y.H. Lee, Y. Goto, M. Refregiers, J. Kardos, Accurate secondary structure prediction and fold recognition for circular dichroism spectroscopy, PNAS.112 (2015) 3095-3103.
2) A. Micsonai, F. Wien, E. Bulyaki, J. Kun, E. Moussong, Y.H. Lee, Y. Goto, M. Refregiers, J. Kardos, BeStSel: a web server for accurate protein secondary structure prediction and fold recognition from the circular dichroism spectra, Nucleic Acids Res.46 (2018) 315-322.