Sugar Analysis in Tea using Optical Rotation and Refractive Index detection
August 22, 2022
Introduction
An optical rotation detector can be used for selective detection of optically active materials.
The sugar in black and lemon teas were analyzed using a combination of optical rotation detector (OR) and refractive index detector (RI).
Figure 1 Chromatogram of a standard sample. Meso-erythritol is optically inactive and can only be detected by refractive index.
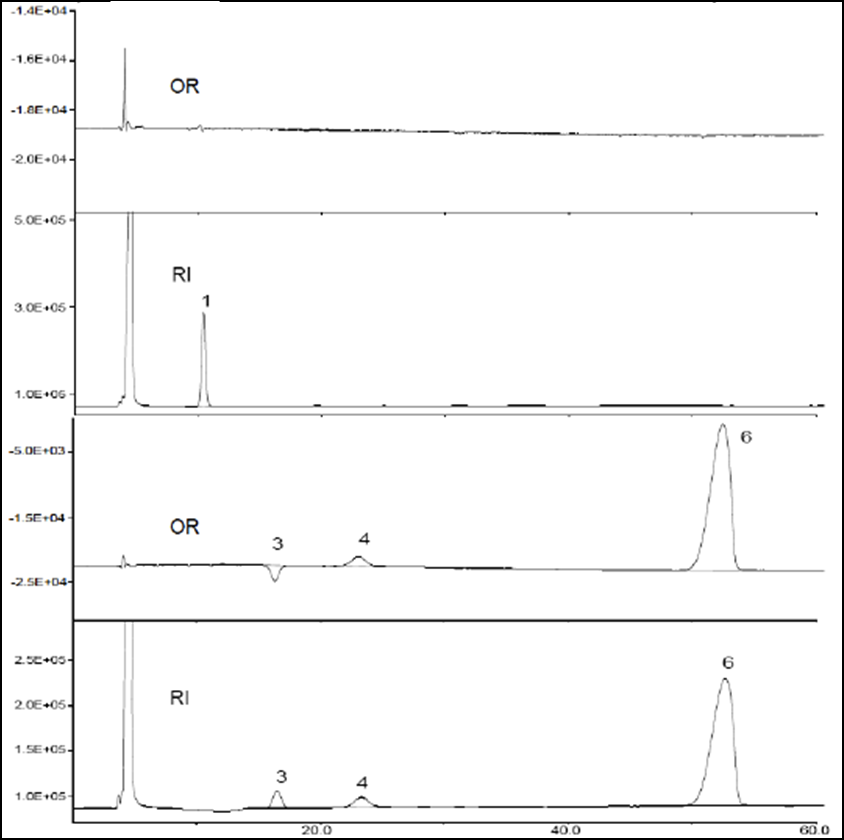
Figure 2 chromatograms of sugar-free black tea and lemon tea.
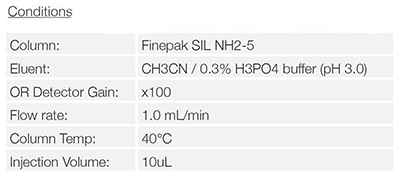
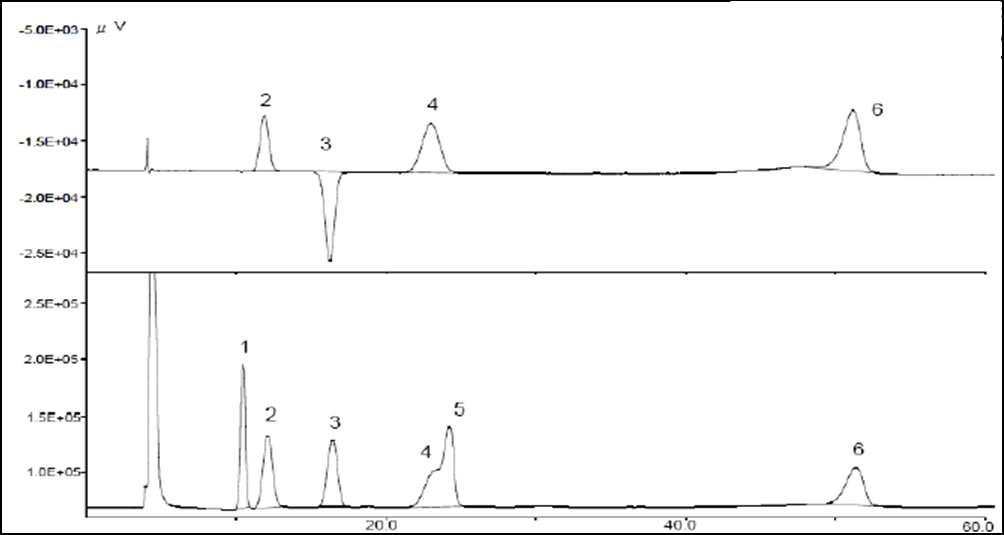
Figure 2, Limonene and Carvone have very similar UV spectra, but show differences in the IR. Co-elution in the chromatogram detected using UV as shown in figure 3 and 4 illustrates the inability of using UV to trigger fraction collection.
Figure 5 shows IR chromatograms at two different wave number ranges and the fractions collected using those chromatograms. A Carvone standard and Spearmint oil were separated using HPLC and fractions 1 and 2 were compared to confirm the separation and purity as seen in Figure 6.
Featured Products:

Sugar Analysis in Tea using Optical Rotation and Refractive Index detection
Introduction
An optical rotation detector can be used for selective detection of optically active materials.
The sugar in black and lemon teas were analyzed using a combination of optical rotation detector (OR) and refractive index detector (RI).
Figure 1 Chromatogram of a standard sample. Meso-erythritol is optically inactive and can only be detected by refractive index.
Figure 2 chromatograms of sugar-free black tea and lemon tea.


Figure 2, Limonene and Carvone have very similar UV spectra, but show differences in the IR. Co-elution in the chromatogram detected using UV as shown in figure 3 and 4 illustrates the inability of using UV to trigger fraction collection.
Figure 5 shows IR chromatograms at two different wave number ranges and the fractions collected using those chromatograms. A Carvone standard and Spearmint oil were separated using HPLC and fractions 1 and 2 were compared to confirm the separation and purity as seen in Figure 6.


 Download This Application