Thermal Melting Analysis of Multiple Samples using High-Throughput Circular Dichroism (HTCD)
August 19, 2022
Introduction
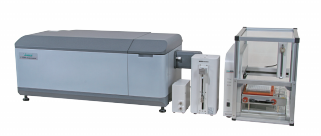
Thermal denaturation CD measurements provide important information regarding a protein’s thermodynamic properties as well as secondary structure characteristics. The J-1500 HTCD system enables researchers to automate not only CD spectral measurements and obtain secondary structure estimations, but also variable temperature measurements and thermal denaturation analysis of multiple samples.
This application note demonstrates the use of the J-1500 CD spectrometer and High-Throughput system to obtain variable temperature measurement data and secondary structure estimations using the Thermal Denaturation Analysis program.
Experimental
| Measurement conditions | |||
|---|---|---|---|
| Data interval | 0.2 °C | Wavelength | 222 nm |
| Spectral bandwidth | 0.2 nm | Path length | 2 nm |
0.2 mg/mL of human serum albumin (HSA), lysozyme and riboneclease A were prepared in H20.
Keywords
J-1500, circular dichroism, proteins, melting temperature analysis, HTCD, ASU-800 Auto Sampler, JFLC-498 Peltier flow cell, pharmaceuticals, biochemistry
Results
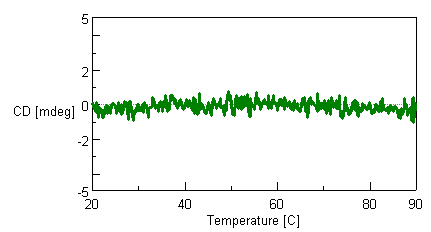
The flow cell for the HTCD system is designed to prevent the influence of temperature increases on baseline measurements. Figure 1 shows that the CD signal of water used as a blank solvent is stable from 20°C to 90°C.
The analysis of the CD results from the variable temperature measurements of HSA, lysozyme, and ribonuclease A are shown below (Figure 2). The thermodynamic properties were calculated using the Thermal Denaturation Program and are shown in Table 1.
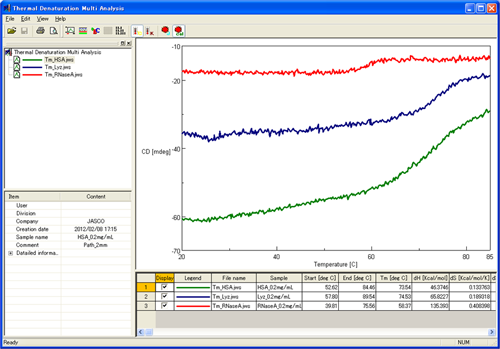
Table 1. Thermodynamic parameters of three proteins measured using the HTCD system and calculated using the Thermal Denaturation Analysis program
| Sample name | Tm (°C) | ΔH (kcal/mol) | ΔS (kcal/mol*K) |
|---|---|---|---|
| Human serum albumin | 73.5 | 46.4 | 0.134 |
| Lysozyme | 74.5 | 65.8 | 0.189 |
| Ribonuclease A | 58.4 | 135.4 | 0.408 |
Conclusion
This application note illustrates that the J-1500 CD spectrometer, coupled with the HTCD system can provide highly precise measurements for multiple protein samples. Additionally, thermodynamic parameters can be easily calculated using the Thermal Denaturation Analysis program.
Featured Products:
-
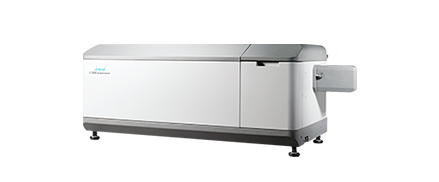
Highest performance with a wide range of accessories for maximum flexibility to meet complex research demands.
J-1500
-
J-1700
-
High-Throughput CD

Thermal Melting Analysis of Multiple Samples using High-Throughput Circular Dichroism (HTCD)
Introduction
Thermal denaturation CD measurements provide important information regarding a protein’s thermodynamic properties as well as secondary structure characteristics. The J-1500 HTCD system enables researchers to automate not only CD spectral measurements and obtain secondary structure estimations, but also variable temperature measurements and thermal denaturation analysis of multiple samples.
This application note demonstrates the use of the J-1500 CD spectrometer and High-Throughput system to obtain variable temperature measurement data and secondary structure estimations using the Thermal Denaturation Analysis program.

Experimental
| Measurement conditions | |||
|---|---|---|---|
| Data interval | 0.2 °C | Wavelength | 222 nm |
| Spectral bandwidth | 0.2 nm | Path length | 2 nm |
0.2 mg/mL of human serum albumin (HSA), lysozyme and riboneclease A were prepared in H20.
Results
The flow cell for the HTCD system is designed to prevent the influence of temperature increases on baseline measurements. Figure 1 shows that the CD signal of water used as a blank solvent is stable from 20°C to 90°C.

The analysis of the CD results from the variable temperature measurements of HSA, lysozyme, and ribonuclease A are shown below (Figure 2). The thermodynamic properties were calculated using the Thermal Denaturation Program and are shown in Table 1.

Table 1. Thermodynamic parameters of three proteins measured using the HTCD system and calculated using the Thermal Denaturation Analysis program
| Sample name | Tm (°C) | ΔH (kcal/mol) | ΔS (kcal/mol*K) |
|---|---|---|---|
| Human serum albumin | 73.5 | 46.4 | 0.134 |
| Lysozyme | 74.5 | 65.8 | 0.189 |
| Ribonuclease A | 58.4 | 135.4 | 0.408 |
Conclusion
This application note illustrates that the J-1500 CD spectrometer, coupled with the HTCD system can provide highly precise measurements for multiple protein samples. Additionally, thermodynamic parameters can be easily calculated using the Thermal Denaturation Analysis program.
Keywords
J-1500, circular dichroism, proteins, melting temperature analysis, HTCD, ASU-800 Auto Sampler, JFLC-498 Peltier flow cell, pharmaceuticals, biochemistry

 Download This Application