UV-Visible Quantification of Allura Red (Red No. 40) in a Sports Drink using a Dip Probe
November 3, 2025 Download This Application
Introduction
Food dyes are a commonly employed food additive, utilizing a psychological association between color and taste.1 Various health organizations establish safety regulations for the amounts of, and which food dyes can be used in food products. To ensure dye concentrations in food sit below established thresholds it is important to accurately quantify the amount of food dye present. Additionally, the widespread availability of food dyes and their prevalence in food have made dye quantification a routine teaching experiment for demonstrating UV-Visible (UV-Vis) spectroscopy.
One of the most common methods of quantification via UV-Vis spectroscopy is the use of an external standard curve where several standards of known concentration are measured to obtain their absorbance value at a particular wavelength. For each point, absorbance is plotted against concentration, and the scatter plot is fit to a linear calibration curve. The calibration curve can then be used to determine the concentration of a dye from the measured absorbance value in an unknown sample. However, this method can lead to errors if there are other components present in the unknown solution.
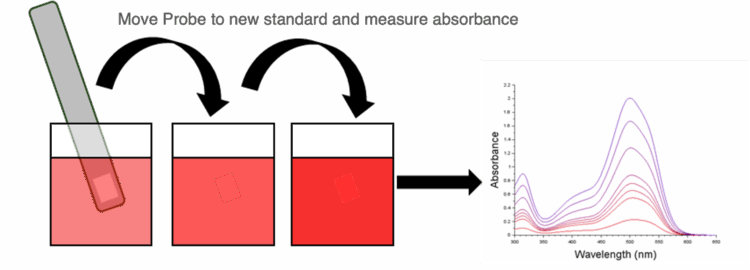
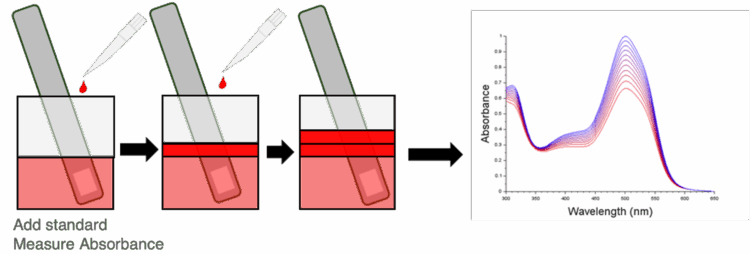
The effects of other components in solution, referred to as matrix effects, can lead to lower or higher absorbance at the wavelength of interest. A way to combat this is to add known amounts of standard directly into an unknown solution thereby accounting for matrix effects (standard addition). Often the total volume is kept constant with different concentrations of standard, but standard addition can also be performed by adding increasing amounts of standard to the same unknown solution (cumulative standard addition). Using a fiber optic dip probe placed into an unknown solution, quantitation can even be performed without opening the UV-Vis sample compartment or swapping cuvettes.
Here the data from two different quantification experiments of Allura Red, or FD&C Red No. 40, are presented: one using an external standard calibration curve and another using cumulative standard addition. In both experiments a dip probe was used in conjunction with a fiber optical interface to easily measure samples in quick succession without the need to use and clean cuvettes. In the standard addition experiment the dip probe allowed for rapid measurement without removing the probe.
Experimental
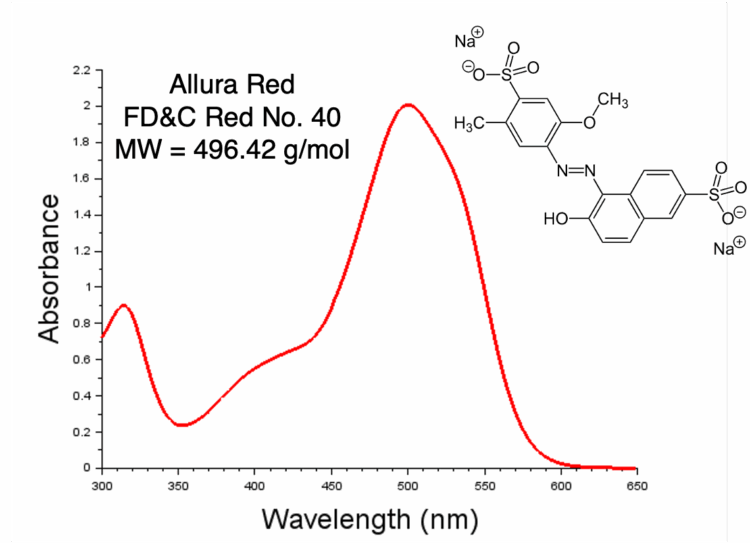
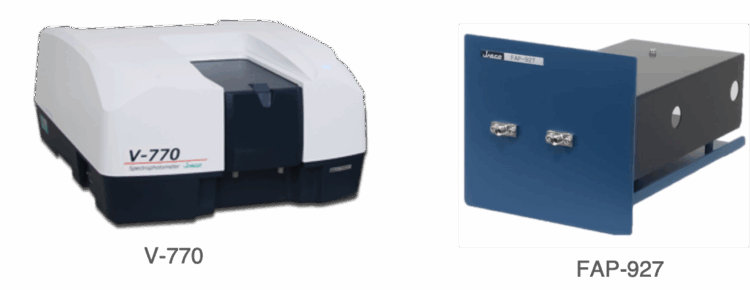
A stock solution of 87.5 μg/mL Allura Red solution was prepared by dissolving Allura Red in ultrapure water. 2.5 mL of sports drink was aliquoted to a vial and the total volume was brought to 10 mL with ultrapure water. Dilution of the sports drink was performed to bring the absorbance value into an acceptable range. For quantification, the absorbance value at 500 nm was used. Measurement was performed with a V-770 UV-Vis Spectrometer, a FAP-927 fiber optic interface, and a UV-Vis Dip probe, which allowed for quick measurement and minimal cleaning.
Two types of quantification were carried out:
- Calibration with Standards
Eight standard Allura Red solutions were prepared by diluting the stock solution with ultrapure water. Each standard was measured using the dip probe and the probe was rinsed with ultrapure water and dried between each measurement. After measurement of the standards, the dilute sports drink was measured with the dip probe.
- Cumulative Standard Addition
First, the dilute sports drink was measured with the dip probe. Then 0.1 mL of the Allura Red stock solution was added, mixed and the solution was measured. This 0.1 mL addition of the stock solution was repeated until 1 mL of Allura Red had been added to the dilute sports drink. For each measurement the dip probe was left in solution making cleaning unnecessary.
System
Instrument: V-770 UV-Visible/NIR Spectrophotometer
Accessories: FAP-927 Optical Fiber Interface
Keywords
UV-Vis spectroscopy, U.S., FDA, synthetic dye, artificial dye, natural colorant, natural color additives, food dye, Quantification, Fiber optic probe
Results
Calibration Curve and Quantification
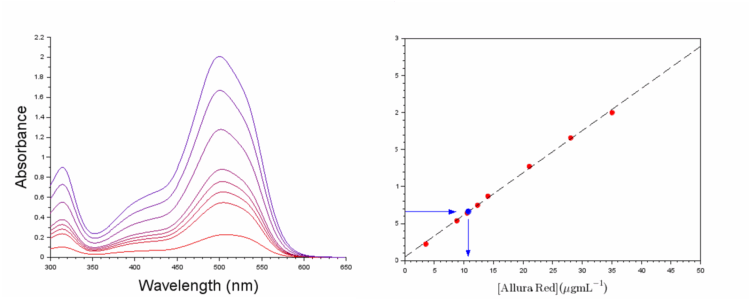
8 Allura Red standards of known concentration were measured by submerging the dip probe directly into each standard vial. After measurement of the absorbance spectra (Figure 5a), the absorbance at 500 nm was extracted and plotted against the concentration of the standard (Figure 5b) in accordance to Beer’s law.
A=εbc (1)
The scatter plot was then fit to a linear function such that
A=mc+B (2)
where
m=εb (3)
, ε is the molar absorptivity , b is the path length, c is the concentration, and B is a small offset from the instrument response.
Equation 2 was then used to determine the concentration of the unknown via the equation
c=(B-A)/m (4)
Conclusion
The results from the external standard calibration curve and cumulative standard addition are very close at 42.8 μg mL-1 and 43.6 μg mL-1 respectively.
| Method | Allura Red (μg mL-1) |
|---|---|
| Calibration Curve | 42.8 |
| Cumulative Standard Addition | 43.6 |
This demonstrates that the Allura Red in the sports drink sample is likely not heavily effect by the presence of other components such as sugar.
The standard addition method using a fiber optic dip probe allowed for quick and easy measurement of quantification data in situ. In contrast, the external calibration curve required cleaning of the dip probe after each standard was measured. Both methods are quicker than the traditional method of using a standard 10 mm cuvette which requires cleaning, drying and replacement of the cell after each measurement.
References
- Sharma, V., McKone, H. T., & Markow, P. G. J. Chem. Ed., 88, 24-28 (2011) DOI: 10.1021/ed100545v