Principals of Attenuated Total Reflectance
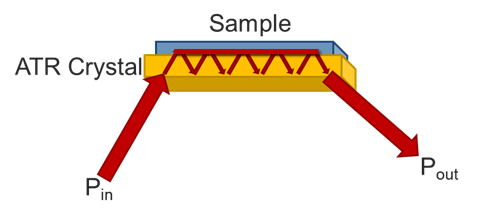
Attenuated Total Reflectance (ATR) differs from transmission or reflection infrared spectroscopies in several key ways that will be covered on this page. Primarily, it is a form of absorption spectroscopy with a small, defined path length. One of the key drivers of its adoption by the scientific community is there is normally little to no sample preparation, unlike most FTIR methods. The infrared light is steered towards the crystal at a specific angle, usually around 45o. When the light reflects off the crystal at that angle, some of the light occurs as a standing wave on the surface of the crystal. If there is a material on the surface, the light will enter the sample and reflect back down, and be steered towards a detector.
Crystal Types
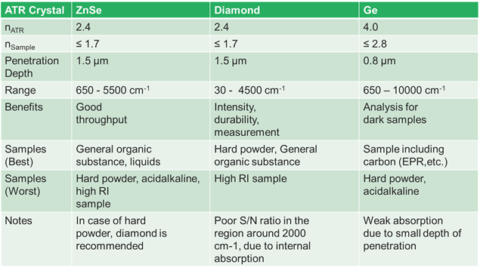
Largely, ATR crystals are made up of materials that are IR transparent. This means that materials such as zinc selenide, diamond, germanium, and silicon make good ATR candidates. Each crystal’s physical and chemical properties make crystal selection important. Most modern ATRs use diamond crystals because they have the obvious properties of hardness and chemical stability. The principal drawback to diamond is that it has a low throughput around 2200 cm-1. If you are looking for CN groups, this can be an issue, but generally there are not a lot of peaks in that region. However, diamond has the highest spectral range with the low wavenumber cut off being about 50 cm-1. ZnSe is a good, low-cost alternative to diamond. It has the highest throughput of the crystals, but is softer than diamond, so care must be had on harder materials. It is important to note that only cotton-based materials should be used to clean ZnSe and Ge crystals. Over time materials, such as Kim Wipes, can abrade the crystal surface. The last, most common crystal is Germanium. Germanium’s cut-off is similar to ZnSe, but has a niche in ATR. Germanium, for reasons that will be discussed later, works better for strongly absorbing materials. It has a high refractive index and a low penetration depth which makes it suitable for these applications. Next, we will discuss how these two factors fit together.
Penetration Depth
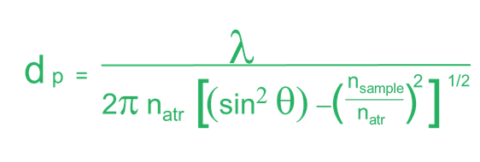
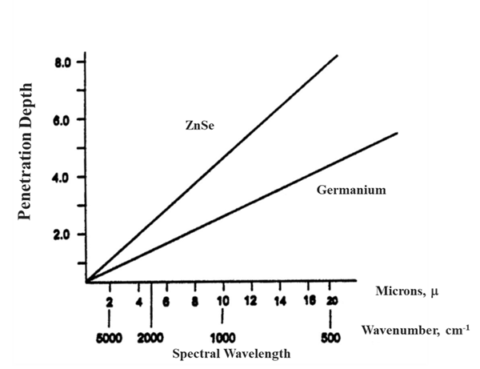
As alluded to earlier, the penetration depth of the light into a sample has some variability. The penetration depth (Equation 1.) is based on several variables. Firstly, it is dependent on the wavelength of the light itself (λ). As seen in figure 3, this means that the depth changes across the spectrum. Ramifications of this will be discussed later, but it means that absorption changes with wavenumber. The next variable is the refractive index of the crystal (nATR). This impacts the spectrum in two ways. Firstly, the higher the refractive index of the crystal, the lower the depth of penetration and, thus, the absorption. Secondly, how well the refractive index of the crystal and that of the sample (nsample) match is important. The refractive index of the crystal should be higher than that of the sample to get good spectra. Finally, the angle of incidence of the light (θ) also determines if you will have optimal absorbance. Since this value is fixed by the hardware, it generally does not change. However, there are some ATR accessories that allow you to change the angle of incoming light. Since this changes the penetration depth of the light, it can give you insight into multilayered samples.
Sampling
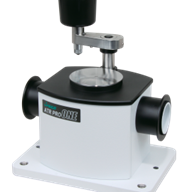
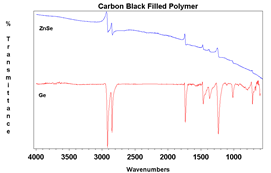
The primary draw to the ATR method is the ease of sampling with it. Liquids may be placed on the crystal without the need for preparation or the use of cells. Solids can be placed onto the crystal, but required a pressure arm (seen in Figure 1.). since the depth of penetration is only on the order of a few microns, the sample must be in close contact with the crystal. Liquids are naturally flat against the crystal, so need no pressure. Powders, however, have a roughness that is greater than the penetration depth, so they need the pressure to maintain contact with the crystal surface. Films and other solid samples also require the pressure clamp. Most sample needs can be met with a low pressure, slip clutch pressure arm, but harder samples may require a high-pressure clamp. Here, crystal choice is again important with diamond being the preferred choice due to its hardness. Besides sample hardness, the refractive index of a material is important. In general, dark materials (e.g., EPR) have a high refractive index. Two spectra showing the same material with two different crystals may be seen in Figure 4. The refractive index mismatch causes the real and imaginary portions of the spectra to be apparent with the ZnSe. It is always a good idea to test your representative samples before selecting a crystal type.
Difference between Transmission
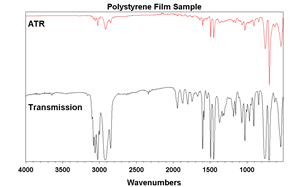
There are a few differences between ATR and traditional transmission spectroscopy. One key difference is path length and sample preparation. Transmission spectroscopy typically has path lengths greater than ten times that of ATR. Because of this, solids typically have to be diluted with KBr (about 3% wt/wt). This is a laborious process and the ATR method is the clear winner. The only drawback comes when comparing ATR spectra to transmission spectra (Figure 5.). Since penetration depth is dependent on wavelength, intensities become smaller as you go to higher wavenumbers relative to a transmission spectrum. Modern software uses Equation 1 to correct for this. Most modern libraries contain ATR spectra, but it is good to note this possibility when comparing spectra.
Microscopy
The ATR method is often used in microscopy as well. One principal difference is that the objective is pressed onto the sample instead of the other way around. The other is the optics used to focus and reflect the light. Since the design of a microscope uses the beam path for both light going to and away from the sample, Cassegrain optics are often used instead of simple plan mirrors. ATR has the advantage of having a small penetration depth and the x- and y-axis can be controlled via apertures. The typical spatial resolution for an ATR microscopy experiment is 5-10 microns. When a diamond ATR crystal is used, you may be able to view the sample as you run the method. This has the advantage of knowing exactly where you are measuring as well as being able to scan multiple points precisely using the apertures. Another benefit is that since the ATR may change the shape of the sample after applying pressure, it allows you to see where you are measuring after contact.
Application Examples
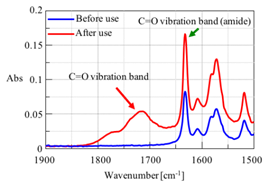
One application is to monitor changes in a compound by looking for changes in the chemical structure. For example, Figure 7 shows spectra in the C=O stretching region for a grease sample before and after use. As can be seen, a carbonyl peak appears after use, indicating that the grease is becoming oxidized. ATR is a better method for grease analysis over transmission because it has a standard sample volume (penetration depth) and can measure highly viscous materials.
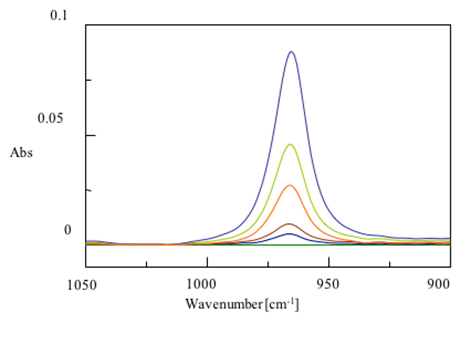
Another common use of ATR is to monitor the concentration of chemicals using a concentration curve. As the amount of a chemical in a mixture increases, the absorption in infrared spectra increases. The known concentrations of chemicals can be plotted against absorption at a specific peak and that line can be used to predict concentrations from a given absorption. In figure 8 you can see the absorption of trans-fats at different concentrations. The resulting calibration is also shown. As you can see, there is a linear relationship between absorbance and concentration.
![]()
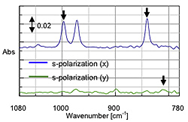
In addition to the set-up described so far, there are many variations of the ATR experiment. Multi-bounce ATRs can see samples with lower absorbances, temperature control can be used to monitor changes in the sample at different temperatures, and polarized light can be used to determine orientation of the compound. Figure 9 shows an example of polarized light being used to determine the type and orientation of a polypropylene film. Polarized light will absorb more strongly on one type (s- or p-polarized) than another in an ordered material. In this case two things were learned. One, the polypropylene is isotactic (not randomly oriented) as seen by the fact that there are differences in s-polarized light spectrum based on the orientation of the film. Two, it is oriented in the x direction as can be seen with the stronger absorption on the x-axis.