




Introduction to Circularly Polarized Luminescence (CPL)
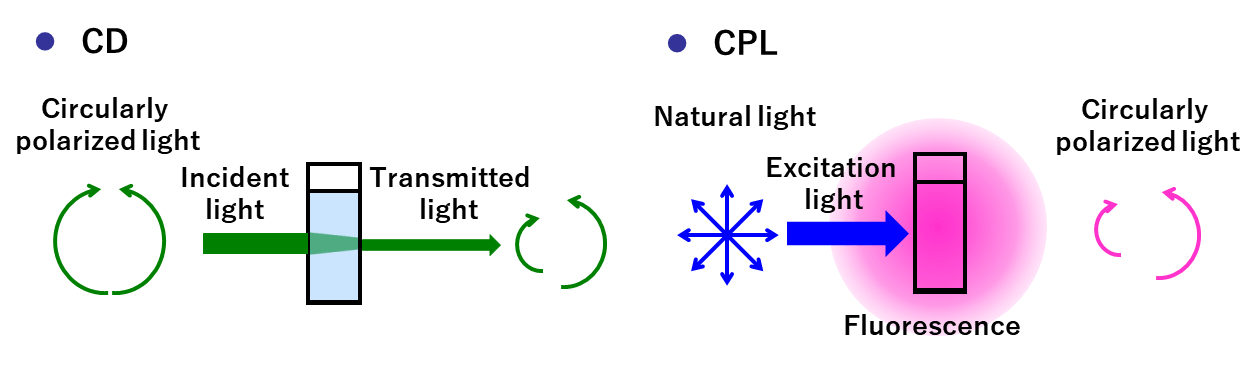
Chiral molecules are molecules which are non-superimposable on their mirror images (enantiomers). upon emission these molecules can produce different intensities of left- and right-handed circularly polarized light (CPL). Circular Dichroism (CD) spectroscopy is widely used in the study of optically active substances. In recent years, Circularly Polarized Luminescence (CPL) spectroscopy has also attracted a great deal of attention. Whereas CD spectroscopy provides information about the structure of optically active substances in the ground electronic state, CPL spectroscopy provides information about excited states. The two methods are therefore complementary to each other.
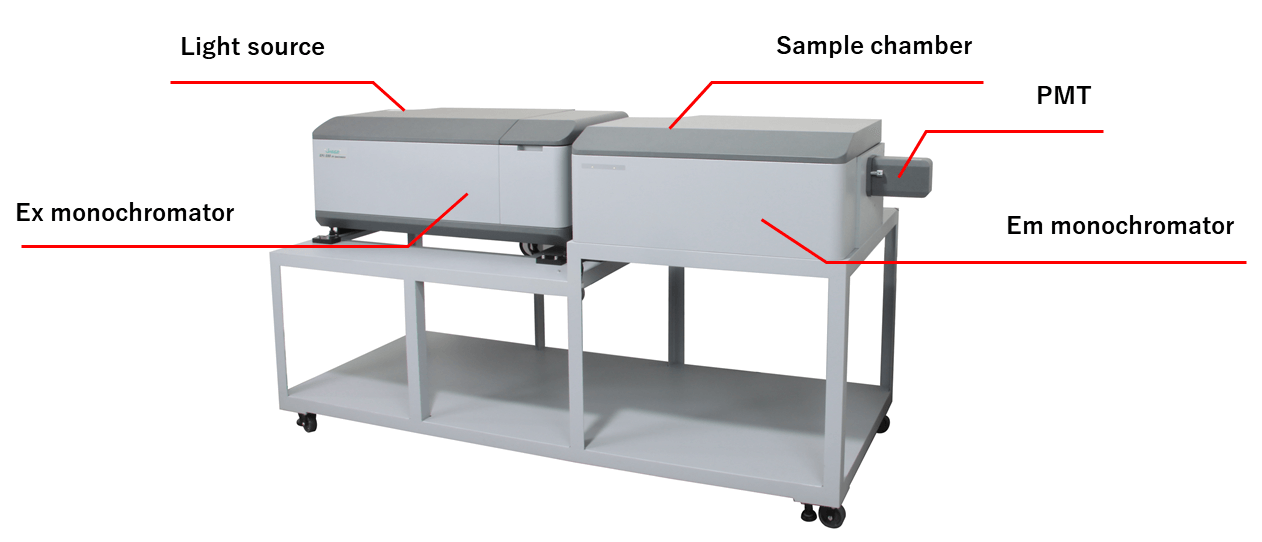
Materials that exhibit circularly polarized luminescence are currently being actively investigated for applications in fields such as liquid crystal display backlights, three-dimensional (3D) displays, holographic displays, light sources for controlling plant growth, and security systems for optical communications and printing. It is therefore important to identify molecules that emit one-handed Circularly Polarized Light (CPL) with a high quantum yield. CPL spectra contain important information such as the stable structure of excited molecules, and the behavior of these molecules in chemical reactions that involve an intermediate excited state. Generally, fluorescence signals from a sample are weak and CPL signals are even weaker, making them difficult to detect. The JASCO CPL-300 achieves high sensitivity for detecting such weak CPL signals and allows measurements to be performed over a wide wavelength range.
Optical System
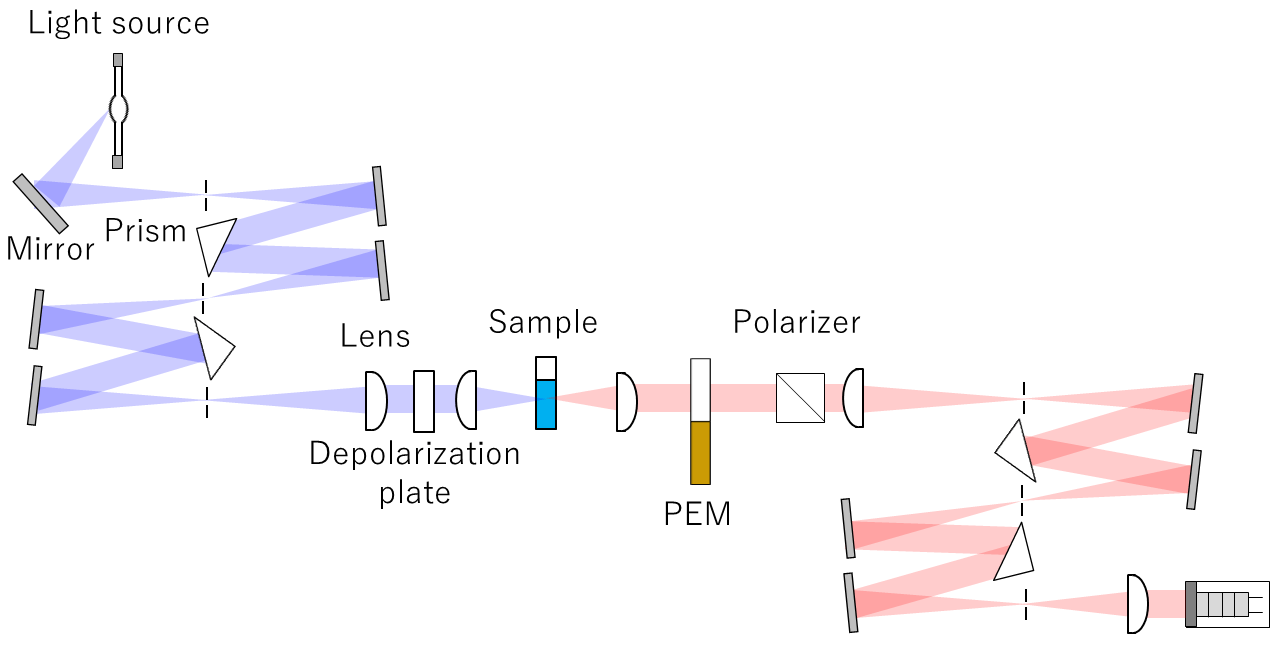
Light from a light source is first passed through a monochromator, and the sample is then irradiated by non-polarized light. The left- and right-handed circularly polarized fluorescence emitted by the sample is alternately linearly polarized at a frequency of 50 kHz using a PEM. A polarizer is placed at the back of the PEM, and the polarized fluorescence is transmitted synchronously with the modulation of the PEM, and is passed through a monochromator and then detected by a detector. This modulation-based approach enables sensitive extraction of CPL signals that would otherwise be obscured by the much stronger total fluorescence background.
Validation
1. Baseline
Measure a solvent blank to ensure CPL siganl is centered at 0 mdeg.
2. Standard Measurement
Measurement of a well characterized material like Eu[(+)-facam]3 is suggested to ensure the CPL is working properly prior to unknown sample measurements.
Features
● Double-prism monochromator
Low stray light, no second-order radiation and no Wood’s anomalies to minimize artifacts.
● 180° sample geometry with unpolarized excitation light
Samples with different transition moments for absorption and fluorescence, and do not become depolarized, can be measured
● Excitation (Ex) and emission (Em) monochromators
Possible to set optimized Ex wavelength and Em spectral bandwidth
● High-throughput optical system and highly sensitive PMT
Increased fluorescence sensitivity
● Data collection and processing
Simultaneous measurements of CPL, ΔI =IL-IR, and fluorescence intensity, I = (IL + IR)/2 One-click data conversion to DI and *glum
*glum: luminescence dissymmetry factor; ΔI/I
Typical glum ranges from 10-4 to 10-1.
Applications of Circularly Polarized Luminescence (CPL)
- Optoelectronics: development of advanced materials for applications such as 3D displays, OLEDs, and security inks, where control over emission polarization enhances device performance and functionality.
- Environmental monitoring and sensing: detection and quantification of chiral pollutants (e.g., certain pesticides and pharmaceuticals) via their CPL signatures or through CPL-active labeling strategies.
- Biomedical imaging and enantioselective sensing: use of CPL-responsive probes and CPL-active tags to enable contrast enhancement and chiral discrimination in fluorescence-based imaging systems.
Experimental
High-resolution measurements of complexes exhibiting very narrow CPL and fluorescence bands
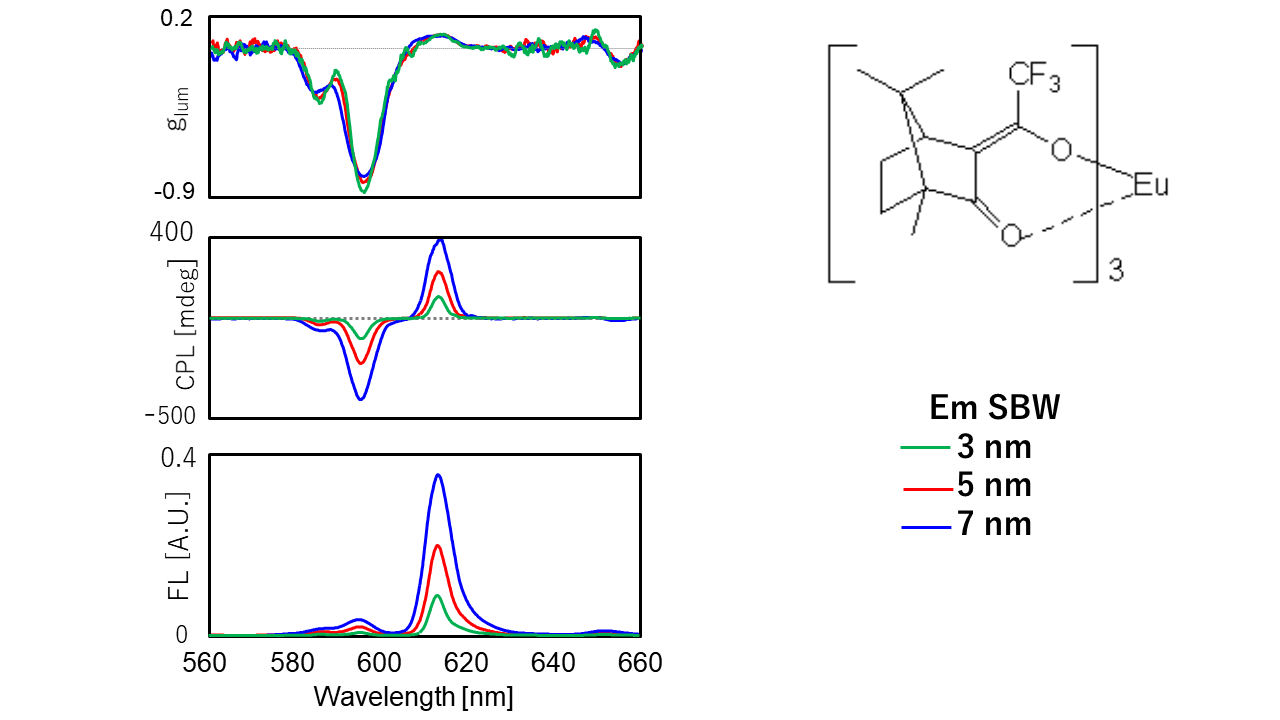
Lanthanoid complexes are widely used as LED materials because of their strong sharp optical emission. They also have potential applications in products such as 3D displays and security markers, and synthesis and evaluation of lanthanoid complexes exhibiting CPL are underway.
The figure on the right shows the change in the CPL spectrum of Eu(facam)3 with fluorescence bandwidth (SBW). Even for compounds producing a very sharp CPL spectrum like Eu(facam)3, the CPL-300 is capable of high-resolution measurements with a small fluorescence bandwidth.
High-sensitivity measurements of green fluorescent protein (GFP)
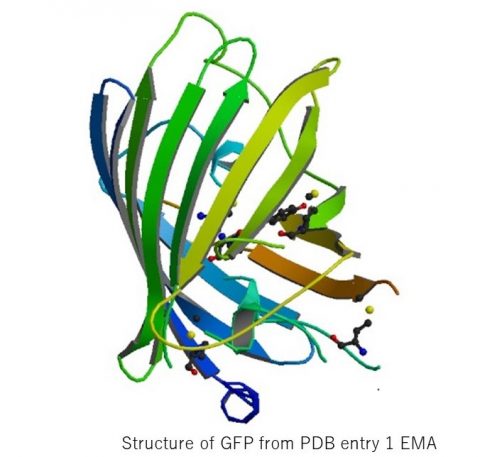
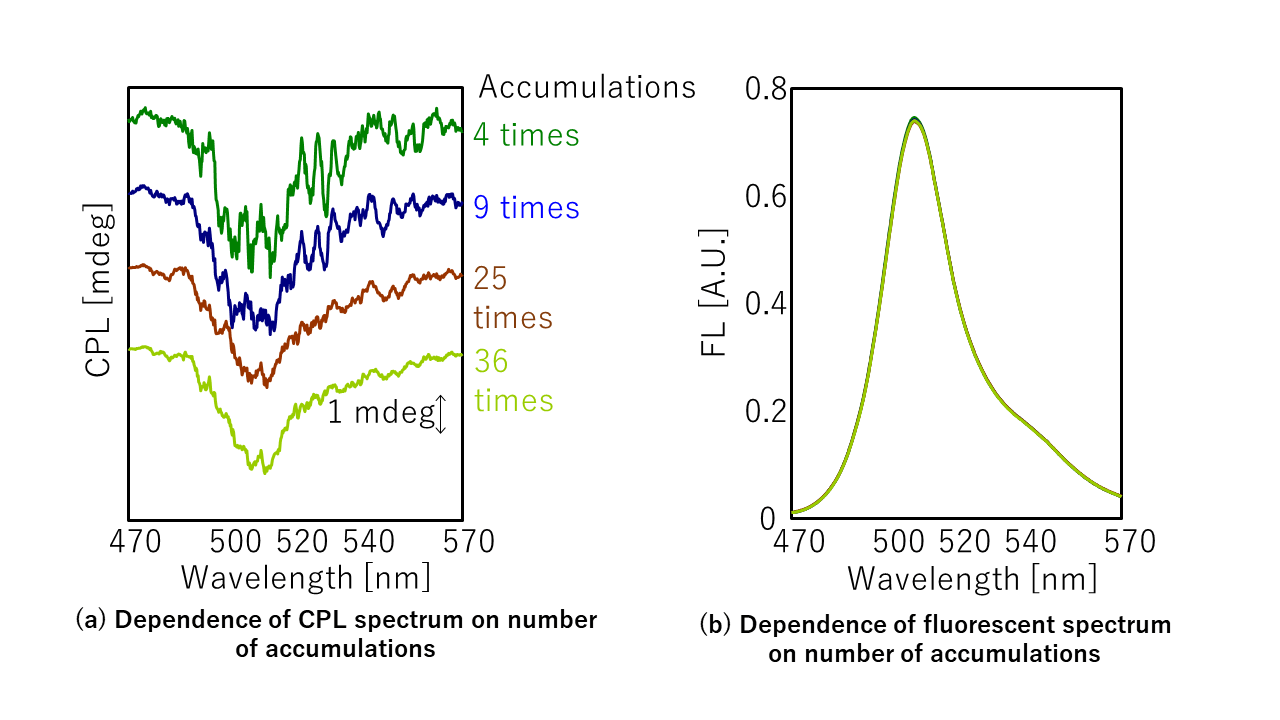
Fig.5 (a) shows CPL spectra of wild-type GFP. Although the sample concentration was only 30 μg/mL and the optical path length was only 10 mm, the CPL spectrum could be clearly observed by increasing the number of accumulations.
Although the S/N could be further improved by using a larger number of accumulations, proteins can become photodegraded under prolonged illumination. Therefore, the temporal change in the fluorescence spectrum was monitored. Fig.5 (b) shows the 1st, 9th, 25th and 36th fluorescence spectrum obtained during the CPL measurements. It can be seen that even after 36 accumulations, no change in the spectral shape occurred.
Measurements of Solid Samples
In the case of a solid sample containing a powder, the spectrum may be affected by artifacts due to birefringence. To determine whether such artifacts are present, it is necessary to measure enantiomers to obtain symmetric spectra, and to rotate the sample around the optical axis to find whether the spectral shape changes or not.
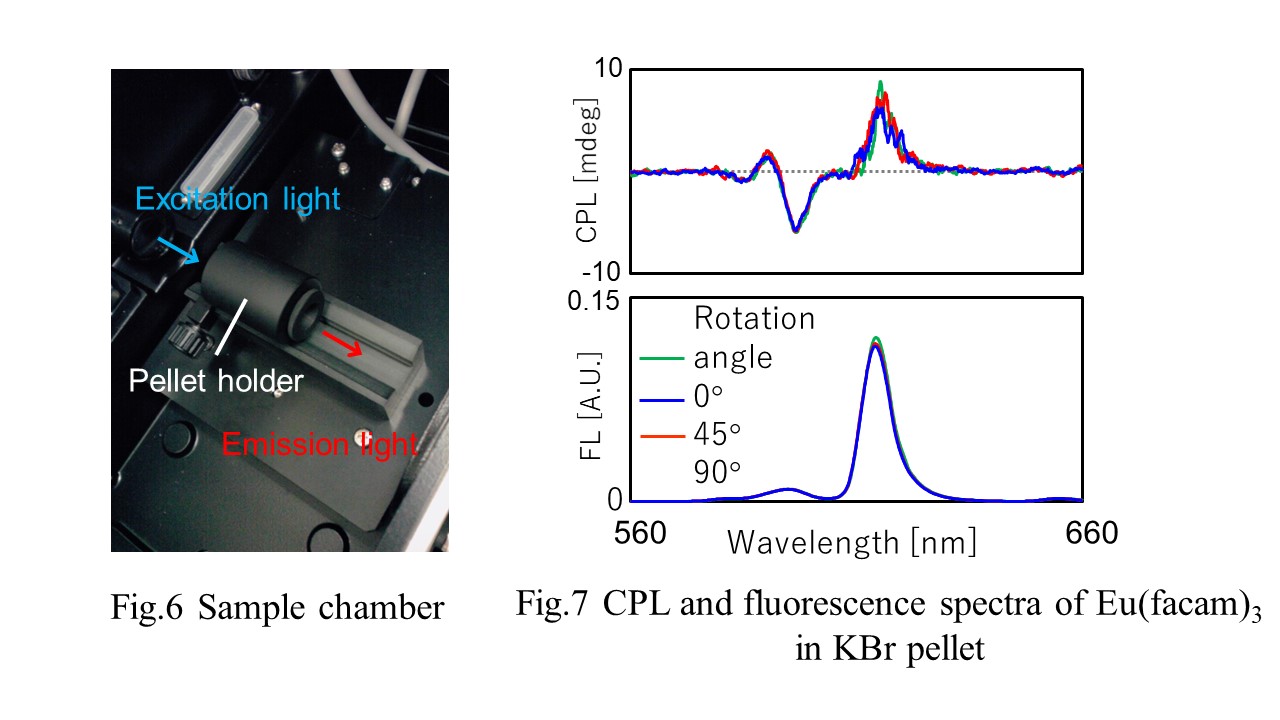
Fig.7 shows spectra of powdered Eu(facam)3 in a KBr pellet measured using this pellet holder. The spectra were obtained at rotation angles of 0°, 45° and 90°. It can be seen that there is no significant change in spectral shape with rotation angle, indicating anisotropy artifact free.
Artifacts and Troubleshooting
Careful diagnostic checks and experimental design are needed to ensure CPL measurements are free from geometry and instrument artifacts:
Linear Polarization Artifacts
Cause: emission with residual linear polarization can be converted into false CPL signal.
Diagnostic
- rotate the sample and observe whether CPL spectrum changes shape or magnitude
Mitigation
- Use detection geometries that minimize polarization effects (e.g. 180o geometry implemented in CPL-300.
Circular Dichroism (CD) and Reabsorption Effects
Cause: Reabsorption of emitted light in chiral samples can introduce distortions related to circular dichroism, leading to apparent CPL signals not originating from emission.
Diagnostics
- Compare spectra at different sample concentrations or thicknesses
- Check whether spectral features correlate with known CD absorption bands
Mitigation
- Use dilute solutions or thin samples to minimize reabsorption
- Select emission wavelengths well separated from strong absorption bands
- Validate results against known standards or literature spectra
Slit Width and Spectral Bandwidth Effects
Cause: Wide slit settings increase signal intensity but reduce spectral resolution and may introduce wavelength averaging effects that distort ΔI and gᵤ values.
Diagnostics
- Record spectra at multiple slit widths and compare spectral shape and magnitude
- Check for artificial smoothing or loss of fine structure
Mitigation
- Optimize slit width to balance sensitivity and resolution
- Use consistent settings when comparing samples or reporting data
- Verify key spectral features at higher resolution when needed
Summary of Best Practices
- Always verify ΔI ≈ 0 baseline using an achiral reference
- Use sample rotation tests to identify polarization artifacts
- Monitor instrument harmonics (e.g., 2f signals) in PEM systems
- Optimize geometry, slit width, and concentration to minimize artifacts
- Leverage instrument design features (e.g., low stray light optics, backscattering geometry) to improve data reliability
Magnetic CPL
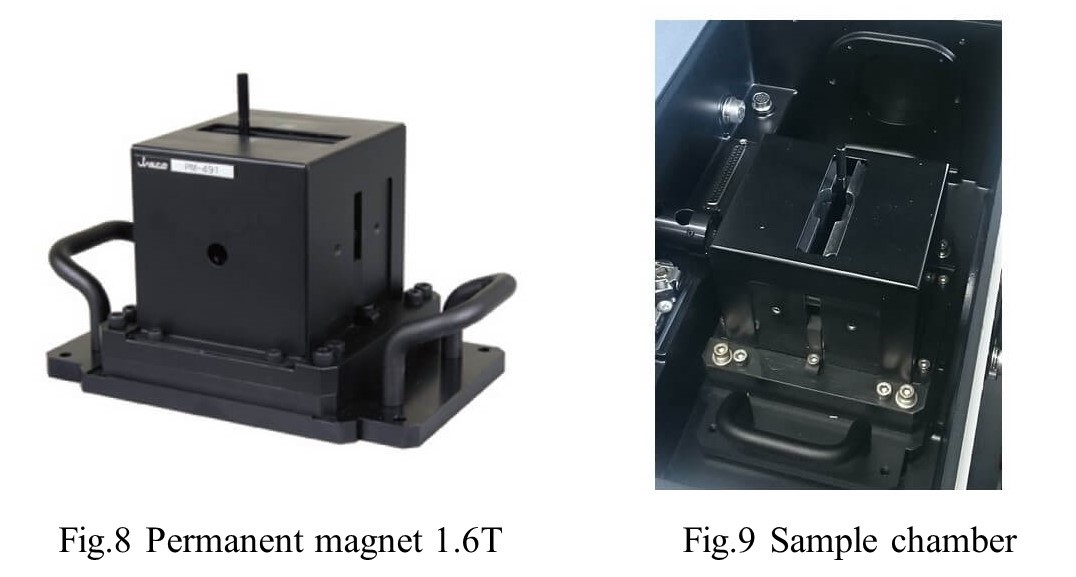
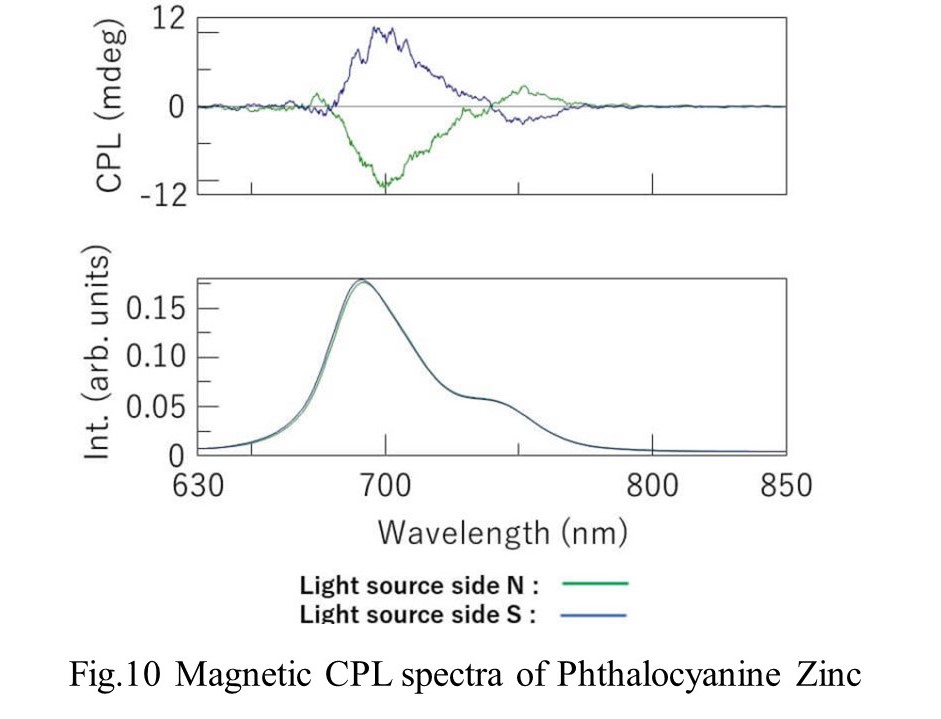
The CPL spectrum shape is inverted according to the direction of the magnetic field
Conclusion
● CPL spectroscopy is receiving increasing attention as chiro optical spectroscopy.
● The CPL-300 has the capability of high-resolution, high-sensitivity, and artifact-free measurements.
● The CPL-300 is expected to contribute to the promotion of further research into CPL materials for use in applications such as 3D displays and security ink.