


Raman spectroscopy is a non-destructive chemical analysis technique that uses a laser to interact with molecular bonds. It measures inelastically scattered light (Raman scattering) to generate a unique molecular fingerprint for identifying and quantifying solids, liquids, and gases.
What is the Raman Effect?
Raman spectroscopy is a popular technique for the analysis of molecular structure and is considered complementary to infrared spectroscopy. It is based on the Raman effect, first identified by physicist Chandrasekhara Venkata Raman in 1928. This effect arises from the scattering of light, which includes both elastic scatter (Rayleigh) at the same wavelength as the incident light and inelastic scatter (Raman) at different wavelengths due to molecular bond vibrations. Although Raman scatter is about a million times less intense than Rayleigh scatter—requiring suppression of the stronger Rayleigh signal to obtain clear spectra—Raman spectroscopy is highly sensitive and typically requires little to no sample preparation. Measurements are non-destructive and can be performed in situ using backscattering geometries or fiber-optic probes, enabling rapid structural characterization.
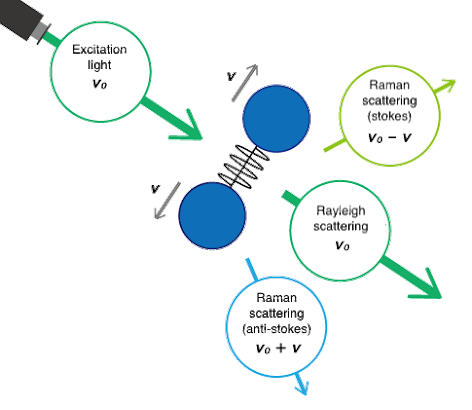
When a laser illuminates a sample, most light scatters elastically at the same wavelength (Rayleigh), while a tiny fraction scatters at different wavelengths due to molecular vibrations (Raman). Raman scattering is ~10^6 times weaker than Rayleigh. The Raman shift (in cm−1) is the energy difference between incident and scattered light; spectra plot intensity versus Raman shift. In the resulting spectrum the vertical axis is the intensity of the scattered light and the horizontal axis is the frequency of the Raman shift (cm-1) in the spectrum.
How a Raman Spectrometer Works
A Raman spectrometer measures how laser light interacts with a sample to produce a spectrum that reveals its molecular structure. The system is designed to deliver laser excitation, collect scattered light, filter out unwanted signals, and detect the resulting Raman spectrum.
Basic Workflow
- A monochromatic laser is directed at the sample
- Light interacts with molecular vibrations, causing scattering
- Most scattered light (Rayleigh) is filtered out
- The weaker Raman-scattered light is collected and dispersed
- A detector records the spectrum, which is analyzed as a chemical fingerprint
Key Components
- Laser Source
- Common wavelengths: 532 nm, 633 nm, 785 nm, and 1064 nm
- Shorter wavelengths provide stronger signal but can increase fluorescence
- Longer wavelengths reduce fluorescence but may lower signal intensity
- Microscope / Sampling Optics
- Focuses the laser onto small sample areas
- Enables Raman imaging and high spatial resolution
- Supports different collection geometries (e.g., backscattering, transmission)
- Rayleigh Rejection Filters
- Remove intense elastically scattered (Rayleigh) light
- Allow only Raman-shifted light to pass to the detector
- Typically implemented using edge or notch filters
- Spectrograph (Monochromator)
- Disperses collected light into its component wavelengths
- Determines spectral resolution and range
- Detector
- CCD (Charge-Coupled Device): common for visible/near-IR Raman systems
- InGaAs detectors: used for longer wavelengths (e.g., 1064 nm FT-Raman)
- Converts light into a measurable signal to generate the Raman spectrum
Collection Geometry
- Backscattering (180°): most common, ideal for opaque samples
- Transmission (180° forward): useful for thin or transparent samples
- Confocal setups: improve depth resolution and enable 3D mapping
What is the Raman shift?
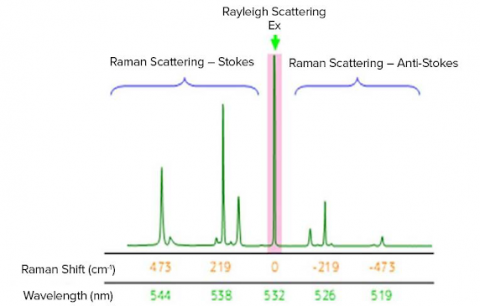
The Raman shift is associated with two different energy bands. The shift at wavelengths higher than that of the incident light is termed Stokes scattering. The shift at wavelengths lower than that of the incident light is termed anti-Stokes scattering. As an example, the Raman spectrum of sulfur measured with an excitation wavelength of 532 nm, green laser(shown in the figure below). Stokes scattering is observed in the lower wavenumber (longer wavelength) region and anti-Stokes scattering in the higher wavenumber (shorter wavelength) region. Typically, higher-intensity Stokes scattering peaks are used for analysis, but anti-Stokes peaks can also be used.
What Is Raman Microscopy and Imaging?
Raman microscopy combines Raman spectroscopy with optical microscopy to analyze materials at a microscopic scale. By focusing a laser onto very small areas of a sample, it enables highly detailed chemical analysis and visualization of material composition.
Raman imaging extends this capability by collecting spectra across a defined area and reconstructing them into a chemical map, showing the spatial distribution of different components within the sample.
Key Benefits
- Chemical Mapping: Visualizes the distribution of compounds, phases, or contaminants across a sample surface
- High Spatial Resolution: Typically achieves ~1 µm resolution (depending on wavelength and optics), enabling analysis of fine structures
- Versatile Sample Analysis: Suitable for solids, powders, thin films, biological samples, and micro-scale features
Raman microscopy is widely used in pharmaceuticals, materials science, semiconductors, and life sciences where understanding both composition and spatial distribution is critical.
Explore JASCO Raman microscopes to see how high-resolution chemical mapping can enhance your analysis.
Difference between Raman spectroscopy and IR spectroscopy
Both Raman spectroscopy and IR spectroscopy are based on molecular vibrations as illustrated below. Infrared spectroscopy is based on absorption of light energy corresponding to the vibrational energy of molecules. Raman spectroscopy is based on scattering of incident light at an energy shifted by the vibrational energy (hν) of the molecule. Vibration modes for the same functional groups are observed at the same wavenumber.
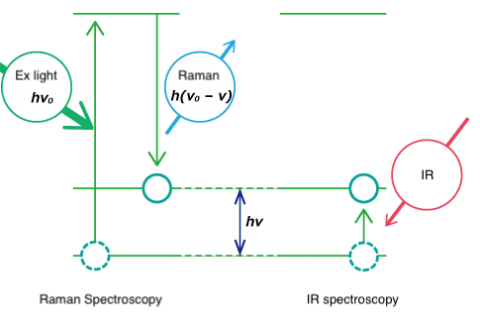
Though both are forms of vibrational spectroscopy, IR and Raman spectroscopy differ in some fundamental aspects, as shown in Fig. 4. IR spectroscopy is based on the fact that molecular absorption at specific vibrational frequencies causes a change in the dipole moment. Raman spectroscopy relies on the change in the polarizability of a molecule at the frequencies (Raman shift) at which the molecule scatters radiation. IR spectroscopy is sensitive to hetero-nuclear functional group vibrations and polar bonds, especially OH stretching in water. Raman spectroscopy is sensitive to homo-nuclear molecular bonds such as C-C, C=C and C≡C bonds.
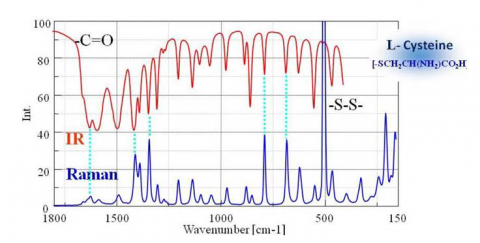
A comparison of IR transmission and Raman spectra for L-cystine is shown in Fig. 5. The intensity of the two spectra exhibit mirror symmetry, so IR and Raman spectra are often considered to be “complementary”. But they are different in the type of physical phenomenon they can measure. In IR measurements, the spectral intensity depends on the size of the dipole moment for vibration modes for bonds such as C=O and O-H. On the other hand, in Raman spectroscopy, the intensity depends on the degree of polarizability (electron volume) for vibration modes for bonds such as S-S, C-C, and CN.
Applications of Raman Spectroscopy
Raman spectroscopy is widely used across multiple industries because it provides fast, non-destructive chemical identification with little to no sample preparation. Its ability to analyze materials in situ and through containers makes it especially valuable in real-world environments.
Pharmaceuticals
- Identify and verify raw materials and active pharmaceutical ingredients (APIs)
- Detect polymorphs and monitor drug formulation consistency
- Enable non-destructive quality control through packaging
- Why Raman is useful: rapid, non-invasive analysis with high chemical specificity
Polymers & Materials Science
- Characterize polymer composition and structure
- Analyze additives, fillers, and degradation
- Monitor manufacturing processes and material performance
- Why Raman is useful: sensitive to molecular structure and crystallinity
Geology & Minerals
- Identify minerals and gemstones
- Study inclusions and phase composition
- Perform field or in situ analysis without sample destruction
- Why Raman is useful: minimal sample prep and strong specificity for inorganic materials
Forensics
- Analyze drugs, explosives, and trace evidence
- Identify unknown substances quickly and non-destructively
- Examine samples through glass or plastic containers
- Why Raman is useful: preserves evidence while delivering rapid identification
In Situ & Process Monitoring
- Monitor chemical reactions in real time
- Perform analysis directly in production environments
- Enable process analytical technology (PAT) for quality assurance
- Why Raman is useful: supports real-time, inline measurements without interrupting processes
Advantages and Limitations
Understanding the strengths and limitations of Raman spectroscopy helps users determine when it is the best analytical technique for a given application.
Advantages
- Non-destructive analysis that preserves samples
- Minimal to no sample preparation required
- Provides a unique chemical fingerprint for precise identification
- Can analyze solids, liquids, and gases
- Suitable for in situ and real-time measurements
- Can measure through glass or transparent packaging
- High sensitivity to molecular structure and crystallinity
Limitations
- Raman signal is inherently weak, which can limit sensitivity in some samples
- Fluorescence interference can overwhelm the Raman signal, especially in organic or impure materials
- Not all materials produce strong Raman scattering
- Can require longer acquisition times for low-signal samples