Rapid HPLC Analysis of Melamine in Dairy Products
June 14, 2024
 Download This Application
Introduction
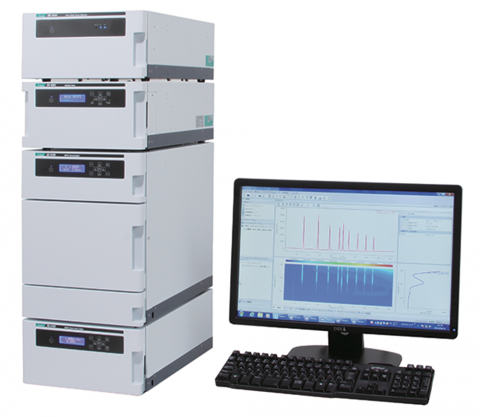
In this report, we will present the results of the analysis of melamine in a milk products using HPLC with a photometric diode-array (PDA) detector.
Melamine is an organic nitrogen compound that has a triazine ring at the center of its structure. It is typically used as melamine resin, which has excellent properties of high thermal and water resistance and is used for mechanical strengthening. Recently, melamine has been found as an additive in dilute milk to make-up for the lack protein content, however, this milk product causes serious health problems. The Food and Drug Administration (FDA) has been evaluating the risks of contamination in food products and has suggested HPLC with UV detection as one of the practical methods for the analysis of melamine.
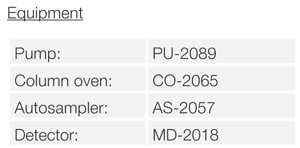
Experimental
Sample preparation: 20 µL of 100 µg/L a melamine standard solution was added to 180 µL of milk, then diluted with 1800 µL of ultrapure water and made up to a total volume of 2mL. The resulting solution was centrifuged at 5000 rpm for 10 minutes and the supernatant filtrated using a 0.45 µm membrane filter.
Keywords
620020H, HPLC, PDA Detector, analysis of melamine, milk, UV detection
Results
Figure 1 shows the structure of melamine, while figure 2 shows the chromatogram and contour plot of melamine.
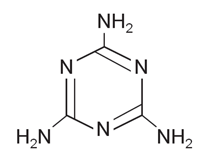
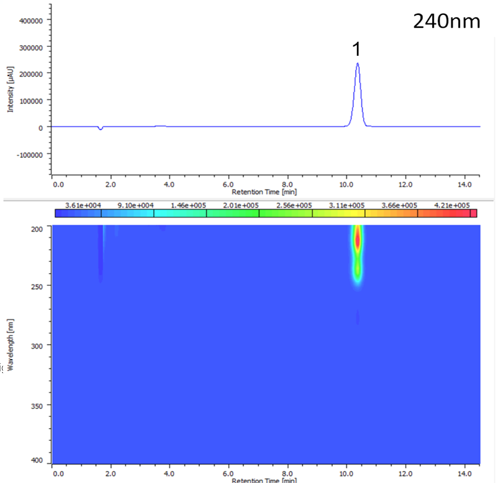
Fig. 3 shows the UV absorption spectrum of the melamine standard.
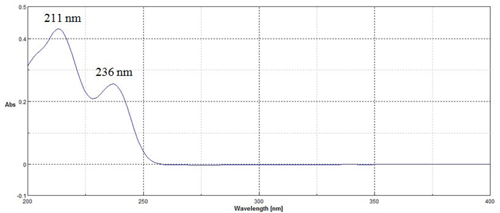
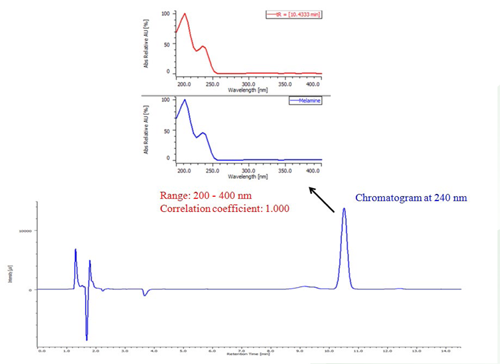
Figure 4 shows the chromatogram and on peak spectrum of milk spiked with melamine. The spectrum of a melamine standard registered in a search library returned a correlation coefficient of 1.0
References
Environ Health Perspect. 2009 Dec; 117(12): 1803–1808.
Published online 2009 Aug 6. doi: 10.1289/ehp.0900949
PMCID: PMC2799451
PMID: 20049196
The Melamine Incident: Implications for International Food and Feed Safety
Céline Marie-Elise Gossner, Jørgen Schlundt,* Peter Ben Embarek, Susan Hird, Danilo Lo-Fo-Wong, Jose Javier Ocampo Beltran, Keng Ngee Teoh, and Angelika Tritscher
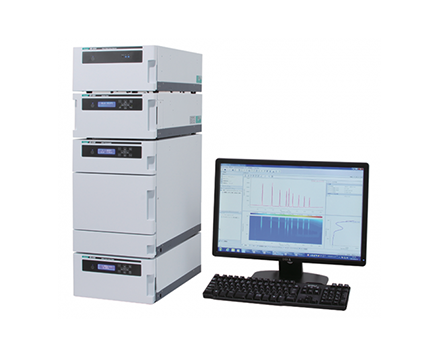
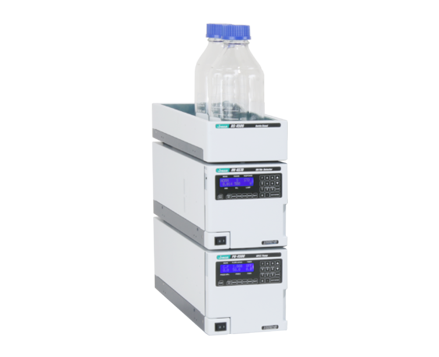
Featured Products:

Rapid HPLC Analysis of Melamine in Dairy Products
Introduction
In this report, we will present the results of the analysis of melamine in a milk products using HPLC with a photometric diode-array (PDA) detector.
Melamine is an organic nitrogen compound that has a triazine ring at the center of its structure. It is typically used as melamine resin, which has excellent properties of high thermal and water resistance and is used for mechanical strengthening. Recently, melamine has been found as an additive in dilute milk to make-up for the lack protein content, however, this milk product causes serious health problems. The Food and Drug Administration (FDA) has been evaluating the risks of contamination in food products and has suggested HPLC with UV detection as one of the practical methods for the analysis of melamine.
Experimental
Sample preparation: 20 µL of 100 µg/L a melamine standard solution was added to 180 µL of milk, then diluted with 1800 µL of ultrapure water and made up to a total volume of 2mL. The resulting solution was centrifuged at 5000 rpm for 10 minutes and the supernatant filtrated using a 0.45 µm membrane filter.
Results
Figure 1 shows the structure of melamine, while figure 2 shows the chromatogram and contour plot of melamine.
Fig. 3 shows the UV absorption spectrum of the melamine standard.
Figure 4 shows the chromatogram and on peak spectrum of milk spiked with melamine. The spectrum of a melamine standard registered in a search library returned a correlation coefficient of 1.0
Keywords
620020H, HPLC, PDA Detector, analysis of melamine, milk, UV detection
References
Environ Health Perspect. 2009 Dec; 117(12): 1803–1808.
Published online 2009 Aug 6. doi: 10.1289/ehp.0900949
PMCID: PMC2799451
PMID: 20049196
The Melamine Incident: Implications for International Food and Feed Safety
Céline Marie-Elise Gossner, Jørgen Schlundt,* Peter Ben Embarek, Susan Hird, Danilo Lo-Fo-Wong, Jose Javier Ocampo Beltran, Keng Ngee Teoh, and Angelika Tritscher