
What is High-Performance Liquid Chromatography (HPLC)?
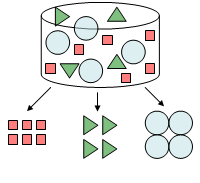
High‑Performance Liquid Chromatography (HPLC) is an analytical technique used to separate, identify, and quantify components in a mixture. Chromatography refers to the measurement method, chromatogram refers to the measurement results, and chromatograph refers to the instrument. Chromatography can be used for qualitative or quantitative analysis. Qualitative analysis refers to “what components are in the mixture,” while quantitative analysis refers to “how much of each component is present in the mixture” (Fig. 1).
HPLC System Components
Every HPLC system consists of several essential components that work together to deliver accurate and reproducible chromatographic separations. The solvent reservoir stores the mobile phase, while the pump delivers the solvent through the system at a precise flow rate and high pressure. The injector or autosampler introduces a measured volume of sample into the flowing mobile phase, which then carries the sample to the HPLC column, where the separation of analytes occurs. After the compounds are separated, they pass through the detector, which converts the analyte response into an electrical signal. Finally, the chromatography data system (CDS) controls the instrument, acquires the detector signal, processes the chromatographic data, and generates qualitative and quantitative analytical results.
HPLC vs RHPLC vs UHPLC: What’s the Difference?
High-performance liquid chromatography (HPLC), rapid high-performance liquid chromatography (RHPLC), and ultra high-performance liquid chromatography (UHPLC) all use the same fundamental chromatographic principles but differ in operating pressure, column technology, separation efficiency, analysis speed, and overall performance. Selecting the right platform depends on analytical requirements, existing methods, throughput goals, and budget.
Conventional HPLC systems remain the industry standard for routine analytical testing, offering excellent reliability, broad method compatibility, and lower operating costs. RHPLC systems bridge the gap between conventional HPLC and UHPLC by operating at higher pressures, allowing laboratories to use smaller particle size and superficially porous (core-shell) columns for faster, higher-resolution separations while preserving compatibility with established HPLC workflows. UHPLC systems provide the highest chromatographic performance by utilizing sub-2 μm particle size columns at ultra-high pressures, producing superior resolution, greater sensitivity, shorter run times, and reduced solvent consumption.
Table 1. Comparison of HPLC, RHPLC, and UHPLC Systems
| Feature | Conventional HPLC | RHPLC | UHPLC |
|---|---|---|---|
| Maximum Pressure | Up to 50 MPa (500 bar / 7,250 psi) | Up to 70 MPa (700 bar / 10,000 psi) | Up to 130 MPa (1,300 bar / 19,000 psi) |
| Typical Particle Size | 3 – 10 μm | 2 – 3 μm and core-shell | Sub-2 μm |
| Analysis Speed | Moderate | Fast | Fastest |
| Resolution | Good | Higher | Highest |
| Sensitivity | Good | Higher | Highest |
| Solvent Consumption | Moderate | Lower | Lowest |
| Method Compatibility | Excellent | Excellent | May require method redevelopment |
| Typical Applications | Routine QC, stability testing | Faster routine methods, method transfer | High-throughput analysis, impurity profiling, advanced research |
When Should You Choose HPLC?
Conventional HPLC remains the preferred choice for laboratories that prioritize method compatibility, robustness, and cost-effective operation.
HPLC is well suited for:
- Routine quality control
- Established and validated analytical methods
- Stability testing
- Academic and teaching laboratories
- Budget-conscious laboratories
When Should You Choose RHPLC?
Rapid HPLC (RHPLC) provides a practical upgrade path for laboratories seeking improved performance without fully transitioning to UHPLC. By supporting 2–3 μm fully porous and superficially porous (core-shell) columns, RHPLC delivers faster analyses and improved resolution while maintaining compatibility with conventional HPLC methods.
RHPLC is ideal for:
- Increasing laboratory throughput
- Improving existing HPLC methods
- Method transfer from conventional HPLC
- Laboratories seeking higher performance with minimal workflow changes
When Should You Choose UHPLC?
UHPLC is designed for laboratories that require the highest chromatographic efficiency. By combining sub-2 μm columns with ultra-high operating pressures, UHPLC delivers maximum resolution, sensitivity, and speed while reducing solvent consumption.
UHPLC is the preferred choice for:
- High-throughput analytical laboratories
- Pharmaceutical method development
- Complex sample matrices
- Trace impurity analysis
- Biotechnology research
- Chiral separations
- Advanced analytical research
Why Smaller Particle Size Improves Chromatographic Performance
The primary advantage of UHPLC comes from its ability to use sub-2 μm particle size columns. Smaller particles increase column efficiency by reducing analyte diffusion and improving mass transfer, resulting in narrower peaks, higher resolution, greater sensitivity, and significantly shorter analysis times. These columns generate substantially higher backpressure, which requires UHPLC systems specifically designed to operate at pressures exceeding 1,000 bar.
The Beginning of Chromatography
Methods for separating components of a mixture include filtration, distillation, and extraction. Chromatography was invented by the Russian botanist Mikhail Semenovich Tswett. In the early 1900s, Tswett packed calcium carbonate in a standing tube, placed pigments extracted from plants on top, and then flushed the tube with petroleum ether as a solvent (Fig. 2).
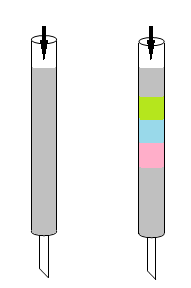
As the extracted pigments began to separate on the chromatograph, each individual pigment appeared as a different band of color as if the light was divided into seven colors by a prism in the tube. For this reason, Tswett named this new separation method chromatography using the Greek words chroma, which means color, and graph, which means record. HPLC is a type of separation method commonly referred to as column chromatography and has been developed to enable separation and analysis in a short period of time by increasing pressure compared to atmospheric pressure.
Separation Mechanism
A mixture of components is placed in a stream of liquid (petroleum ether in Fig. 3), called the mobile phase, and moved through a solid medium (calcium carbonate powder in Fig. 3), called the stationary phase. The components in the mixture move with the flow of the mobile phase, interacting with the stationary phase. Each component’s retention time, or the amount of time a compound spends on the column after it has been injected, depends on the strength of its interaction with the stationary phase. Components that interact strongly with the stationary phase move slowly and have a longer retention time, while components that interact weakly move quickly and have a shorter retention time, allowing the components to be separated.
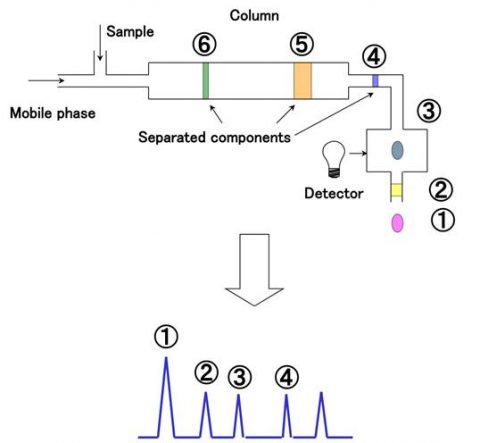
The separated components can then be analyzed using a variety of different detectors depending on their chemical and physical properties. For example, an ultraviolet (UV) detector can detect components based on UV absorption. The chromatogram is obtained by measuring the retention time on the X axis and the intensity of the UV signal on the Y axis. If the measurement conditions are the same, the retention time for the standard sample whose components are known and that for the unknown sample can be compared to identify the components. According to Beer’s Law, the absorption intensity is proportional to the concentration so a calibration curve can be prepared using a standard sample and the component concentration can be determined by measuring the peak area or height.
Factors Affecting HPLC Separation Performance
HPLC separation performance depends on several interacting variables. Understanding how these factors influence retention time, resolution, and peak shape is essential for optimizing methods and achieving reliable results.
The quality of an HPLC separation depends on several interacting variables that influence retention time, chromatographic resolution, peak shape, analysis time, and overall method reproducibility. Understanding how analyte properties, column chemistry, mobile phase composition, temperature, and flow rate affect chromatographic behavior is essential for successful HPLC method development, troubleshooting, and method optimization.
Analyte Properties
The physical and chemical properties of an analyte determine how strongly it interacts with the stationary and mobile phases. Polarity, hydrophobicity, molecular size, and chemical structure all influence retention behavior. In reversed-phase HPLC (RP-HPLC), more hydrophobic compounds typically exhibit longer retention times because they interact more strongly with the nonpolar stationary phase.
- Polarity and chemical structure determine retention and selectivity.
- Molecular size can influence chromatographic behavior and diffusion.
- Ionizable compounds are highly sensitive to mobile phase pH and buffer composition.
- Hydrophobic analytes generally exhibit longer retention in reversed-phase HPLC.
Stationary Phase (Column Chemistry)
The HPLC column is the heart of the separation. Stationary phase chemistry determines analyte selectivity, while particle size, pore size, and column dimensions influence chromatographic efficiency and resolution. Selecting the appropriate column chemistry is often one of the most effective ways to improve a separation.
Column characteristics that affect performance include:
- Stationary phase chemistry controls selectivity and retention.
- Smaller particle sizes generally improve efficiency and resolution.
- Pore size influences the separation of larger molecules, such as peptides and proteins.
- Column contamination, fouling, or aging can reduce efficiency and degrade peak shape.
Mobile Phase Composition
The mobile phase composition plays a critical role in controlling retention time, selectivity, and peak symmetry. Solvent strength, organic solvent concentration, pH, buffer selection, and mobile phase additives all influence chromatographic performance and should be optimized together during method development.
Important mobile phase variables include:
- Organic solvent strength (e.g., acetonitrile or methanol) directly affects retention time.
- pH and buffer choice influences analyte ionization, peak shape, and selectivity.
- Buffer composition helps improve retention time reproducibility and peak shape.
- Specialized additives, such as ion-pairing reagents, can improve the separation of specific compounds, such as ionic compounds.
Column Temperature
Column temperature affects both chromatographic performance and system pressure. Increasing temperature lowers mobile phase viscosity, reducing backpressure while improving mass transfer within the column. Temperature changes can also alter analyte selectivity and stability, making precise temperature control important for reproducible analyses.
Temperature typically affects:
- Mobile phase viscosity and system backpressure.
- Retention time and overall analysis speed.
- Peak shape and chromatographic efficiency.
- Analyte stability and selectivity.
- Higher temperatures generally decrease viscosity, improving flow and reducing backpressure.
- Can shorten retention times and sharpen peaks.
Flow Rate
The mobile phase flow rate determines how long analytes interact with the stationary phase and directly influences analysis time, chromatographic resolution, and system pressure. The optimum flow rate depends on the column dimensions, particle size, and analytical objectives.
General guidelines include:
- Higher flow rates shorten analysis time but may reduce chromatographic resolution.
- Lower flow rates increase analyte interaction time and can improve separation.
- Flow rate should be optimized together with column dimensions, particle size, and mobile phase composition.
- Excessively high flow rates increase system backpressure and may reduce column efficiency.
How to Read an HPLC Chromatogram
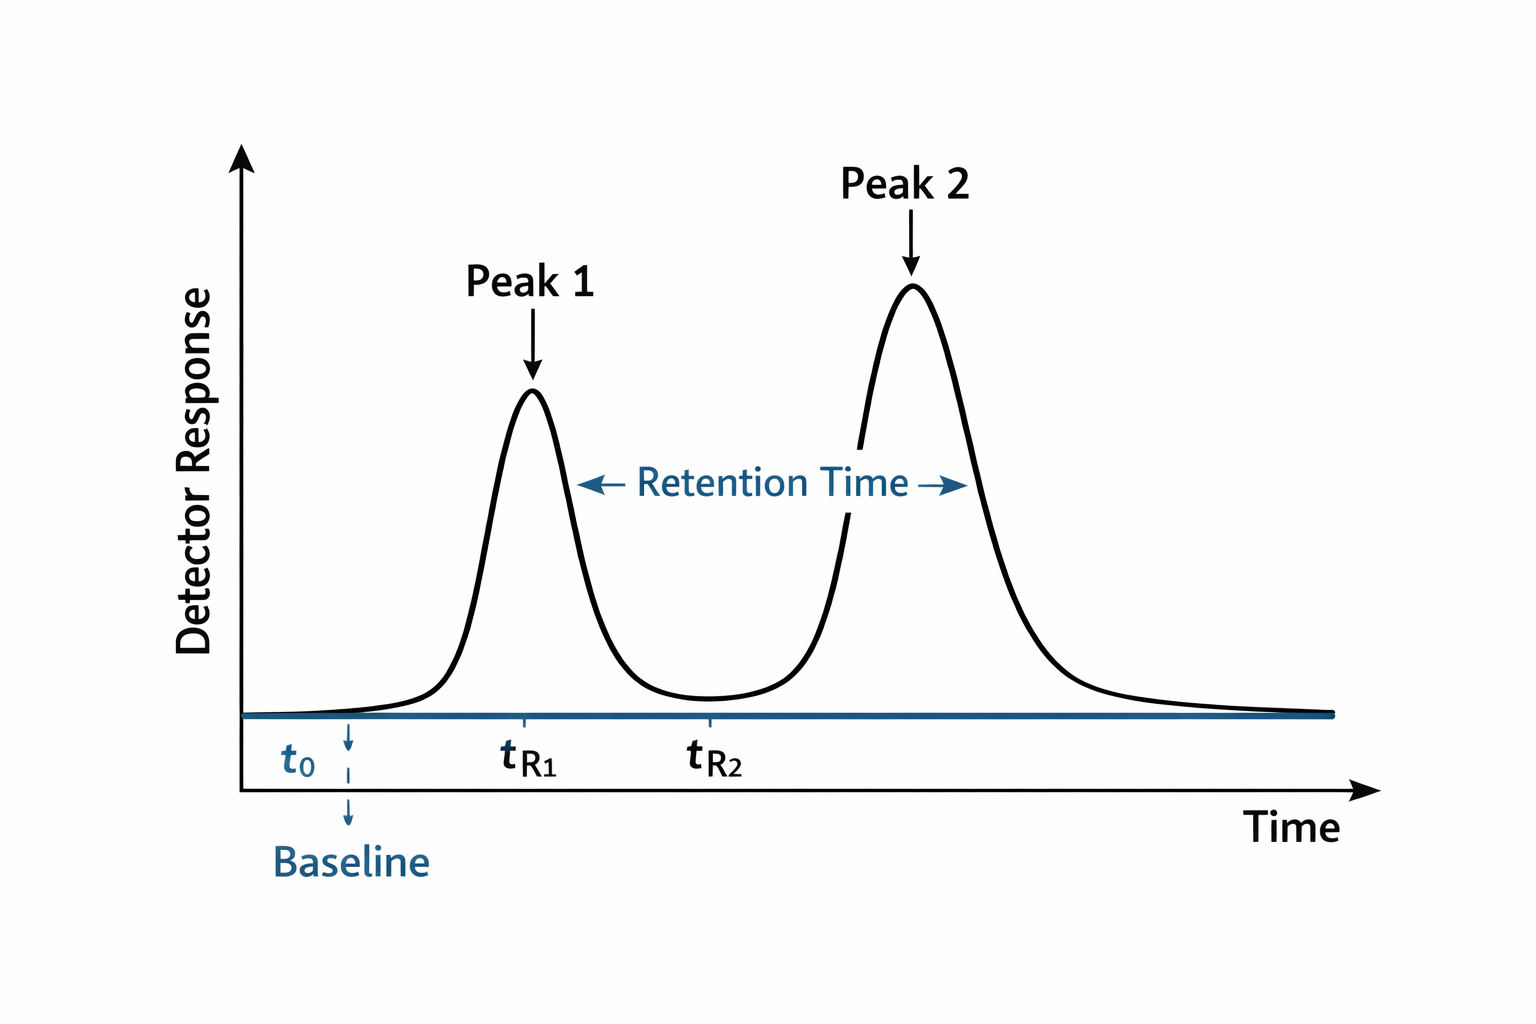
Understanding how to interpret a chromatogram is an essential skill for anyone new to HPLC. A chromatogram is the visual output of an HPLC analysis, showing how compounds in a sample separate over time as they pass through the detector.
Below is a simplified example of a typical HPLC chromatogram with key features labeled.
Key Components of a Chromatogram
Baseline
In HPLC, the baseline is the flat signal observed when no analyte is being detected, representing the detector response to the mobile phase alone. A stable, smooth baseline is essential for good system performance, as it directly supports accurate and reproducible measurements. HPLC provides both qualitative and quantitative results with high precision and reproducibility: qualitative identification is based on retention times compared with standards under the same conditions, while quantitative analysis is typically determined from peak area (preferred) or peak height using calibration curves prepared from known standards. Proper system suitability, along with a stable baseline, ensures method accuracy and repeatability.
Retention Time (tR)
Retention time is the amount of time required for a compound to travel through the HPLC system from the moment it is injected until it reaches the detector. It is measured from sample injection to the apex (highest point) of the chromatographic peak. Under constant chromatographic conditions, each compound has a characteristic retention time, making it an important parameter for compound identification when compared with reference standards. Changes in retention time may also indicate variations in mobile phase composition, flow rate, column temperature, or column performance.
Dead Time (t0)
Dead time, also known as void time, is the time required for an unretained compound to travel through the HPLC system and reach the detector. It represents the shortest possible elution time because compounds that do not interact with the stationary phase will elute at approximately t0. Dead time is an important chromatographic parameter that is used to evaluate column performance and calculate the retention factor (k’), which describes how strongly an analyte is retained by the stationary phase.
Peak Height
Peak height is the vertical distance from the chromatographic baseline to the apex of a peak. It reflects the detector response at the point where the analyte concentration is highest. While peak height can be used for quantitative analysis, particularly when peaks are narrow, symmetrical, and well resolved, it is more sensitive to changes in peak shape, peak broadening, and chromatographic conditions than peak area. As a result, peak height is less commonly used for routine quantitative HPLC analysis.
Peak Area
Peak area is the total integrated area beneath a chromatographic peak and represents the total amount of analyte that reaches the detector during elution. Because peak area accounts for the entire peak rather than just its maximum height, it is less affected by peak broadening or slight variations in chromatographic conditions. For this reason, peak area is the preferred measurement for quantitative HPLC analysis and is used in most analytical methods to determine compound concentration.
Peak Height vs. Peak Area
Both peak height and peak area can be used to quantify analytes, but they differ in how they measure the detector response. Peak height measures only the maximum intensity of the detector signal, whereas peak area measures the total detector response across the entire chromatographic peak. Because peak area is less influenced by changes in peak width and peak shape, it generally provides more accurate and reproducible quantitative results. Peak height may still be appropriate for methods that produce very sharp, symmetrical, and well-resolved peaks, but peak area is the preferred measurement for most modern HPLC applications.