Complex Forming Reaction of Nickel Sulfate and Rochelle Salt Probed by Stopped-Flow CD Spectroscopy
January 5, 2024
Introduction
Stopped-flow CD is a well-known method to probe the unfolding and refolding processes of proteins in order to obtain secondary structure information on a millisecond time scale. Stopped-flow CD can also be used outside the realm of protein dynamics, to observe complex-forming reactions. Transition metal complexes typically exhibit absorption bands in the visible to near-infrared region of the spectrum and CD measurements can be used to probe structural changes that occurr in this region.
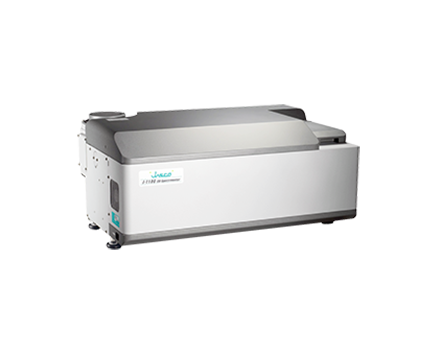
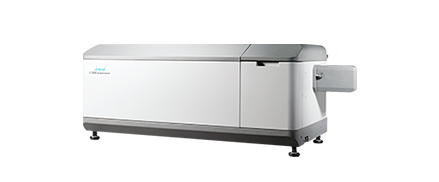
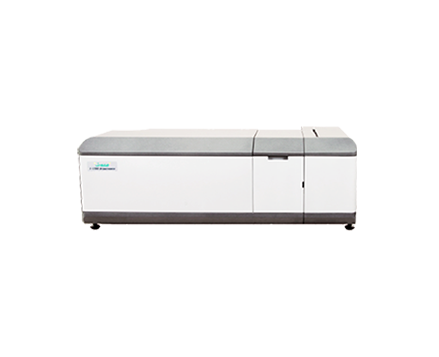
This application note demonstrates the measurement of the complex-forming reaction of nickel sulfate and Rochelle salt using a High Speed Stopped-Flow system consisting of a J-1500 CD spectrometer and a SFS-562T stopped-flow accessory.
Keywords
180-CD-0010, J-1500, Circular Dichroism, CD, stopped-flow, SFS-562T, transition metal complexes, kinetics, infrared, visible, chemical
Results
| Measurement Conditions | |
|---|---|
| Measurement wavelength | 1 nm |
| Path length | 2 mm |
| Spectral bandwidth | 5 nm and 10 nm |
| Data pitch | 1 msec |
| Accumulations | 75 and 50 times |
| Response time | 2 msec |
| Syringe 1 | 0.24 M nickel sulfate |
| Syringe 2 | 0.36 M Rochelle salt |
| Mixing ratio | 100 µL:100 µL |
| Total flow rate | 5 mL/sec |
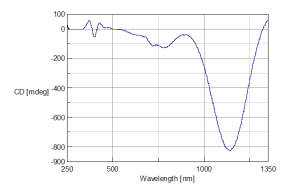
Figure 1 illustrates the CD spectra of 1:1 solution sample of nickel sulfate and Rochelle salt. The CD spectrum exhibits a single, broad peak from the ultraviolet (UV)-visible to near infrared (NIR) region.
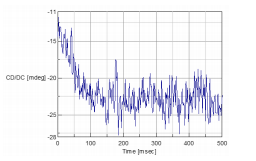
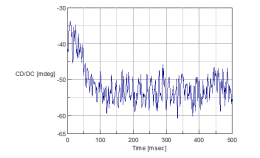
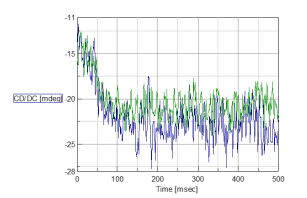
The stopped-flow CD spectra of nickel sulfate and Rochelle salt are shown in Figure 2-4. The data illustrated in Figure 2 were obtained at 720 nm and Figure 3 were obtained at 1000 nm. Figure 4 shows both the spectra obtained at 720 and 1000 nm for comparison. After 100 msec the data for both wavelengths begin to level off, indicating that the complexforming reaction is complete. This also means that the data measured at both 720 and 1000 nm observe the same reaction process.
Conclusion
This application note demonstrates that the J-1500 CD spectrometer and SFS-562T stopped-flow accessory can be used to monitor complex-forming reactions and their completion time.
References
- Miyake, H., Sugimoto, H., Tamiaki, H., and H. Tsukube, (2005) Chem. Commun., 429104293.
- Miyake, H., Kamon, H., Ikuko, M., Sugimoto, H., and H. Tsukube, (2008), JACS, 130, 792-793
Featured Products:

Complex Forming Reaction of Nickel Sulfate and Rochelle Salt Probed by Stopped-Flow CD Spectroscopy
Introduction
Stopped-flow CD is a well-known method to probe the unfolding and refolding processes of proteins in order to obtain secondary structure information on a millisecond time scale. Stopped-flow CD can also be used outside the realm of protein dynamics, to observe complex-forming reactions. Transition metal complexes typically exhibit absorption bands in the visible to near-infrared region of the spectrum and CD measurements can be used to probe structural changes that occurr in this region.
This application note demonstrates the measurement of the complex-forming reaction of nickel sulfate and Rochelle salt using a High Speed Stopped-Flow system consisting of a J-1500 CD spectrometer and a SFS-562T stopped-flow accessory.

Results
| Measurement Conditions | |
|---|---|
| Measurement wavelength | 1 nm |
| Path length | 2 mm |
| Spectral bandwidth | 5 nm and 10 nm |
| Data pitch | 1 msec |
| Accumulations | 75 and 50 times |
| Response time | 2 msec |
| Syringe 1 | 0.24 M nickel sulfate |
| Syringe 2 | 0.36 M Rochelle salt |
| Mixing ratio | 100 µL:100 µL |
| Total flow rate | 5 mL/sec |
Figure 1 illustrates the CD spectra of 1:1 solution sample of nickel sulfate and Rochelle salt. The CD spectrum exhibits a single, broad peak from the ultraviolet (UV)-visible to near infrared (NIR) region.

The stopped-flow CD spectra of nickel sulfate and Rochelle salt are shown in Figure 2-4. The data illustrated in Figure 2 were obtained at 720 nm and Figure 3 were obtained at 1000 nm. Figure 4 shows both the spectra obtained at 720 and 1000 nm for comparison. After 100 msec the data for both wavelengths begin to level off, indicating that the complexforming reaction is complete. This also means that the data measured at both 720 and 1000 nm observe the same reaction process.


Conclusion
This application note demonstrates that the J-1500 CD spectrometer and SFS-562T stopped-flow accessory can be used to monitor complex-forming reactions and their completion time.
Keywords
180-CD-0010, J-1500, Circular Dichroism, CD, stopped-flow, SFS-562T, transition metal complexes, kinetics, infrared, visible, chemical
References
- Miyake, H., Sugimoto, H., Tamiaki, H., and H. Tsukube, (2005) Chem. Commun., 429104293.
- Miyake, H., Kamon, H., Ikuko, M., Sugimoto, H., and H. Tsukube, (2008), JACS, 130, 792-793

 Download This Application