Evaluation of the component distribution and particle analysis using micro Raman spectroscopy
January 5, 2024
 Download This Application
Introduction
Analysis using Raman a spectrophotometer does not typically require any sample pretreatment; measurement can be performed non-destructively and without direct contact. Therefore, it is possible to evaluate the component distribution while maintaining the sample integrity. In addition, with the JPA Particle Analysis program it is also possible to evaluate the variation in particle size and shape, etc. The particle size distribution can be displayed as a histogram together with sample shape information from the observed image, combined with the chemical images. This method is particularly useful for the analysis of a variety of different materials such as resins, foods, pharmaceuticals, and microplastics.
In this application note, we evaluated the distribution of diamond in a diamond polishing sheet using particle analysis software.
Experimental
A diamond polishing sheet was placed on the stage for imaging measurement.
| Measurement Conditions | |||
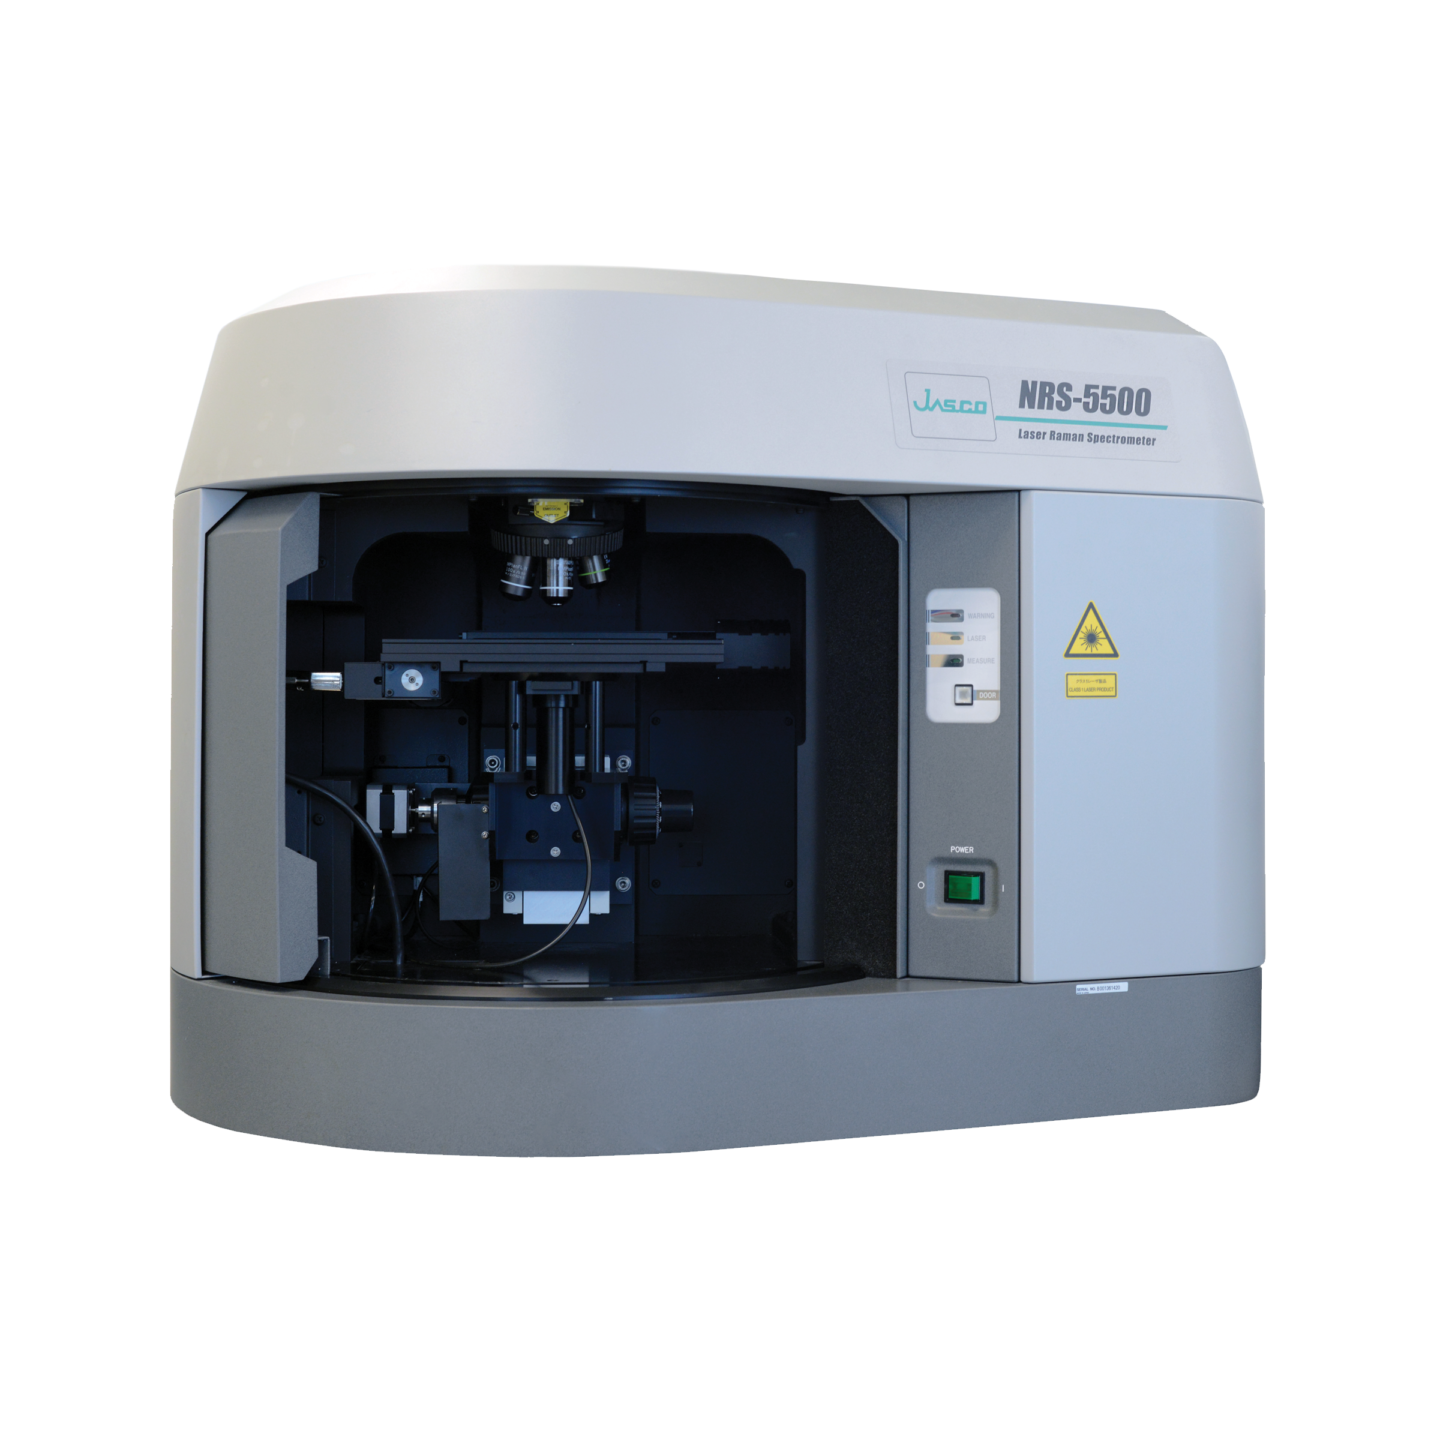
| Main Unit | NRS-5500 Raman spectrometer | Measurement Points | 170 x 170 points (Approx. 500 x 500 µm) |
| Ex Wavelength | 532 nm | Measurement Interval | 3 µm |
| Exposure Time | 0.03 seconds | Accumulation | 1 |
| Objective Lens | 50x Long working distance | ||
Keywords
170-AN-0025, Raman spectroscopy, QRi, mapping, particle analysis, diamond
Results
Figure 2 shows the results of imaging measurement and analysis, in addition to diamond, cerium oxide (a glass abrasive compound) was detected in the spectrum shown in (b). When a chemical image was created using peak height for the diamond peak indicated by the blue arrows in the spectrum, it was confirmed that the diamond particles were distributed as shown in (c).
In addition, (e) and (f) show the results of analysis of (c) using JASCO Particle Analysis*. (e) is a histogram in which the particle size (diameter calculated as the equivalent circle diameter) is plotted on the Y-axis, with its almost normal distribution on the X-axis. Also, from the correlation distribution of particle size and circularity shown in (f ), higher circularity is found for particles near the average size value or smaller (especially 4 µm or less). While larger particles have a lower circularity, with a greater number of ellipse- or rod-shapes. Particle analysis using histograms and correlation distributions can be useful when controlling the size and shape of the components in a final product or when evaluating products from different manufacturing processes or from different lots.
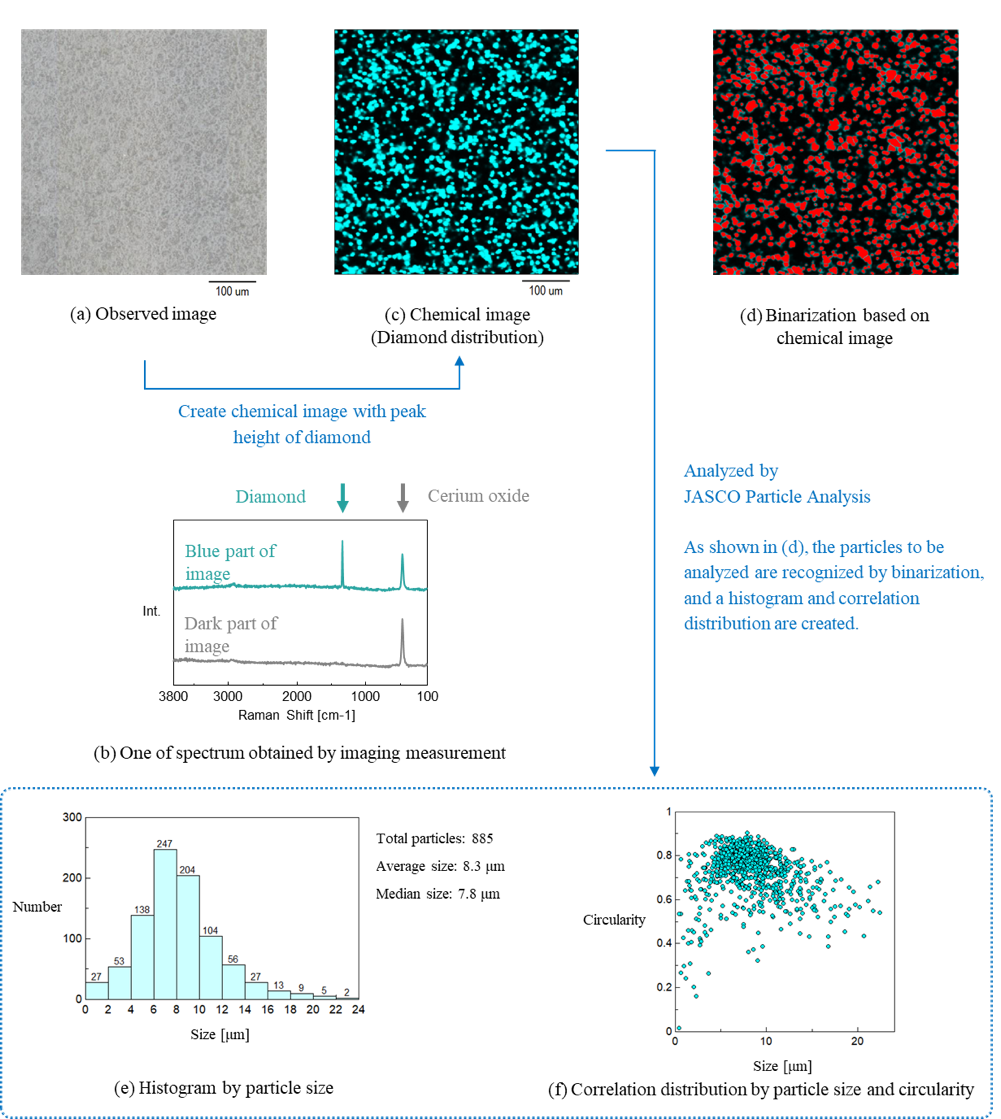
*With JASCO Particle Analysis, in addition to acquiring the size, area, circularity, aspect ratio, etc. of each particle, histograms (which can be converted into stacked histograms), frequency distribution tables, and correlation distributions can be created easily.
<Regarding imaging measurement>
Measurement took approx. 20 minutes (using QRI).
A spectrum with accepatable S/N was obtained for analysis with an exposure time per point of 0.03 sec (30 msec). Shortening the acquisition time or changing to a faster EMCCD detector, it is possible to further reduce the measurement time.
Conclusion
Raman spectroscopy can generally be used to evaluate the component distribution with non-destructive, non-contact, and no pretreatment of the sample. Detailed analysis is possible by visualizing the component distribution and acquiring the shape information using the JASCO Particle Analysis application.
| System Configuration | ||||
| Model | Description | P/N | Remarks | |
| Main Unit | NRS-5500 | Raman Spectrometer | 7119-J051A | 532 nm laser 100 mW laser was used, but a standard 50 mW is also available. |
| Options | QRI 5000/7000 | QRI option | 7119-J278A | |
| RHG5-600B500 | 600 gr/mm grating | 6947-J293A | ||
| LMPLFLN 50x | Objective lens | 1108-0102 | Long work distance | |
| JPA | JASCO particle analysis | 7081-J114A | Particle Analysis Software | |
<Regarding imaging measurement>
Measurement took approx. 20 minutes (using QRI).
A spectrum with accepatable S/N was obtained for analysis with an exposure time per point of 0.03 sec (30 msec). Shortening the acquisition time or changing to a faster EMCCD detector, it is possible to further reduce the measurement time.
Featured Products:

Evaluation of the component distribution and particle analysis using micro Raman spectroscopy
Introduction
Analysis using Raman a spectrophotometer does not typically require any sample pretreatment; measurement can be performed non-destructively and without direct contact. Therefore, it is possible to evaluate the component distribution while maintaining the sample integrity. In addition, with the JPA Particle Analysis program it is also possible to evaluate the variation in particle size and shape, etc. The particle size distribution can be displayed as a histogram together with sample shape information from the observed image, combined with the chemical images. This method is particularly useful for the analysis of a variety of different materials such as resins, foods, pharmaceuticals, and microplastics.
In this application note, we evaluated the distribution of diamond in a diamond polishing sheet using particle analysis software.
Experimental
A diamond polishing sheet was placed on the stage for imaging measurement.
| Measurement Conditions | |||
| Main Unit | NRS-5500 Raman spectrometer | Measurement Points | 170 x 170 points (Approx. 500 x 500 µm) |
| Ex Wavelength | 532 nm | Measurement Interval | 3 µm |
| Exposure Time | 0.03 seconds | Accumulation | 1 |
| Objective Lens | 50x Long working distance | ||
Results
Figure 2 shows the results of imaging measurement and analysis, in addition to diamond, cerium oxide (a glass abrasive compound) was detected in the spectrum shown in (b). When a chemical image was created using peak height for the diamond peak indicated by the blue arrows in the spectrum, it was confirmed that the diamond particles were distributed as shown in (c).
In addition, (e) and (f) show the results of analysis of (c) using JASCO Particle Analysis*. (e) is a histogram in which the particle size (diameter calculated as the equivalent circle diameter) is plotted on the Y-axis, with its almost normal distribution on the X-axis. Also, from the correlation distribution of particle size and circularity shown in (f ), higher circularity is found for particles near the average size value or smaller (especially 4 µm or less). While larger particles have a lower circularity, with a greater number of ellipse- or rod-shapes. Particle analysis using histograms and correlation distributions can be useful when controlling the size and shape of the components in a final product or when evaluating products from different manufacturing processes or from different lots.
*With JASCO Particle Analysis, in addition to acquiring the size, area, circularity, aspect ratio, etc. of each particle, histograms (which can be converted into stacked histograms), frequency distribution tables, and correlation distributions can be created easily.
<Regarding imaging measurement>
Measurement took approx. 20 minutes (using QRI).
A spectrum with accepatable S/N was obtained for analysis with an exposure time per point of 0.03 sec (30 msec). Shortening the acquisition time or changing to a faster EMCCD detector, it is possible to further reduce the measurement time.
Conclusion
Raman spectroscopy can generally be used to evaluate the component distribution with non-destructive, non-contact, and no pretreatment of the sample. Detailed analysis is possible by visualizing the component distribution and acquiring the shape information using the JASCO Particle Analysis application.
| System Configuration | ||||
| Model | Description | P/N | Remarks | |
| Main Unit | NRS-5500 | Raman Spectrometer | 7119-J051A | 532 nm laser 100 mW laser was used, but a standard 50 mW is also available. |
| Options | QRI 5000/7000 | QRI option | 7119-J278A | |
| RHG5-600B500 | 600 gr/mm grating | 6947-J293A | ||
| LMPLFLN 50x | Objective lens | 1108-0102 | Long work distance | |
| JPA | JASCO particle analysis | 7081-J114A | Particle Analysis Software | |
<Regarding imaging measurement>
Measurement took approx. 20 minutes (using QRI).
A spectrum with accepatable S/N was obtained for analysis with an exposure time per point of 0.03 sec (30 msec). Shortening the acquisition time or changing to a faster EMCCD detector, it is possible to further reduce the measurement time.
Keywords
170-AN-0025, Raman spectroscopy, QRi, mapping, particle analysis, diamond