Separation, Identification, and Quantification of Synthetic Dyes in Commercial Food and Beverages by HPLC
November 6, 2025 Download This Application
Introduction
Dyes have historically been added to foods and beverages to enhance their visual appeal and influence flavor perception, as color strongly shapes our expectations and experiences of aroma, taste, and flavor.1 In recent years, research has shown that for some children, exposure to synthetic food dyes is associated with increased moodiness, inattentiveness, and hyperactivity, leading to increased regulatory scrutiny and industry reformulation efforts.
In January 2025, the U.S. Food and Drug Administration (FDA) announced that Red 3 would no longer be authorized for use in food, requiring manufacturers to reformulate their products by January 15, 2027.3 In April 2025, the FDA accelerated these efforts, requesting an expedited phase out of Red 3 and initiating the removal of Citrus Red 2 and Orange B from authorized use. At the same time, the FDA began collaborating with the industry to phase out additional synthetic dyes, including Green 3, Red 40, Yellow 5, Yellow 6, Blue 1, and Blue 2, by the end of 2026.4 To support this transition, in May 2025, the FDA approved three new natural source food color additives, including Galdieria extract blue, butterfly pea flower extract, and calcium phosphate. Although compliance to these regulatory changes remain voluntary at the federal level, many manufacturers have already begun reformulating their products to align with the FDA guidance.5
As more manufacturers reformulate their products to transition away from synthetic dyes to natural alternatives, having reliable analytical methods are essential to accurately quantify dye concentrations to verify reformulation success and ensure regulatory compliance. This application note presents the use of high-performance liquid chromatography (HPLC) coupled with a photodiode array (PDA) detector for the qualitative and quantitative analysis of seven synthetic food dyes, with particular emphasis on the five most widely used. The method provides a robust and reproducible solution for quality control laboratories and manufacturers to monitor synthetic dye content in foods and beverages, supporting both reformulation efforts and regulatory compliance.
Experimental
System Configuration: LC-4000 Series
Instruments
Pump: PU-4180-LPG
Autosampler: AS-4050
Column oven: CO-4060
PDA detector: MD-4010
HPLC Conditions
Column: Restek Ultra C18 (4.6 mm I.D. x 250 mm L, 5 µm)
Eluent A: 10 mM ammonium acetate in water / acetonitrile (95/5)
Eluent B: 10 mM ammonium acetate in water / acetonitrile (15/85)
Gradient: (A/B), 0 min (100/0) – 5 min (75/25) – 8 min (75/25) – 13 min (65/35) – 17 min (65/35) – 17.05 min (100/0), 1 cycle; 20 min
Flow rate: 1.0 mL/min
Column temperature 40 °C
Wavelength: 200 – 900 nm
Injection volume: 50 µL
Standards
Seven synthetic dyes that are commonly used in foods and beverages were used as standards.
| Synthetic Dye | Dye Content |
|---|---|
| Erythrosin B (Sigma Aldrich) | 88% |
| Allura Red AC (Sigma Aldrich) | 80% |
| Fast Green FCF (Sigma Aldrich) | 99% |
| Tartrazine (Sigma Aldrich) | 88% |
| Sunset Yellow FCF (Sigma Aldrich) | 96.2% |
| Erioglaucine disodium salt (Sigma Aldrich) | 88.1% |
| Indigo carmine (Sigma Aldrich) | 93% |
The chemical structure of the synthetic dye standards are shown in Figure 1.
Standard Preparation
A 100 µg/mL stock solution was prepared by dissolving 2 mg of each of the seven synthetic dyes in a total volume of 20 mL of HPLC-grade water (H2O). This 100 µg/mL stock solution was serial diluted with HPLC-grade H2O to produce five standard solutions (1, 5, 10, 25, and 50 µg/mL).
Samples
Three unknown samples were qualitatively and quantitatively analyzed for synthetic dyes.
- Blue Sports Drink
- Yellow Freeze Pop
- Purple Gelatin Dessert
Sample Preparation
- The blue sports drink was injected neat.
- The yellow freeze pop was injected neat.
- 5.5000g of powder purple gelatin dessert was dissolved in 1/8 cup (29.573 mL) warm HPLC-grade H2O and vortexed until homogenous, then injected neat.
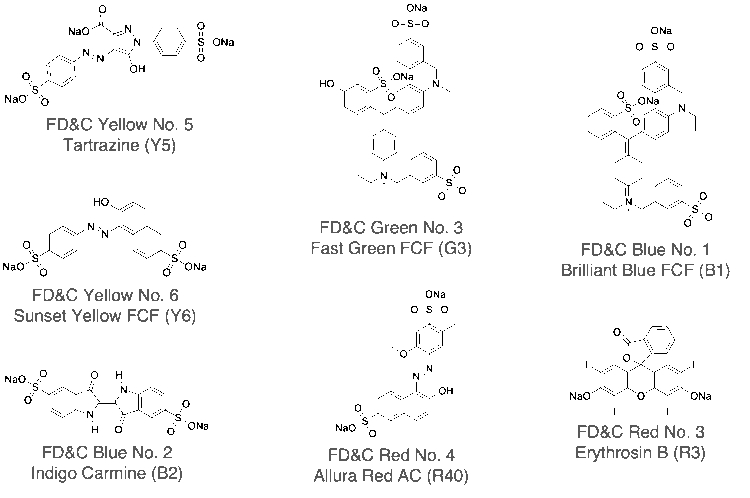
Fig. 1 Chemical structures of petroleum-based synthetic dyes
Keywords
High-Performance Liquid Chromatography, HPLC, photometric diode array, photodiode array, PDA, U.S. Food and Drug Administration, FDA, synthetic dye, artificial dye, natural colorant, natural color additives, FD&C Green No. 3, FD&C Red No. 40, FD&C Yellow No. 5, FD&C Yellow No. 6, FD&C Blue No. 1, FD&C Blue No. 2, Tartrazine, Yellow 5, Y5, Indigotine, Indigo Carmine, Blue 2, B2, Sunset Yellow FCF, Yellow 6, Y6, Allura Red AC, Red 40, R40, Fast Green FCF, Green 3, G3, Brilliant Blue FCF, Blue 1, B1, Erythrosine, Red 3, R3, Galdieria extract blue, butterfly pea flower extract, calcium phosphate
Results
The five standard solutions were analyzed under the HPLC conditions listed in the experimental section producing the five overlaid chromatograms shown in Figure 2.
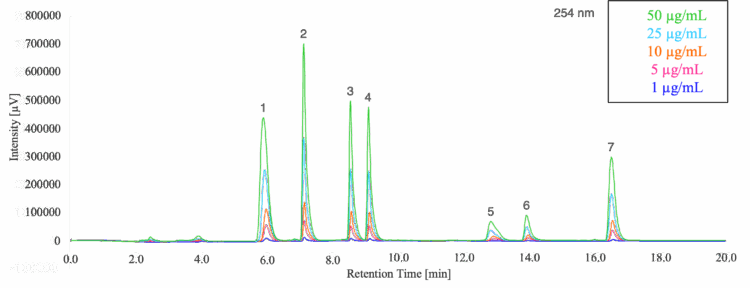
1: Tartrazine (Y5), 2: Indigo Carmine (B2), 3: Sunset Yellow FCF (Y6), 4: Allura Red AC (R40),
5: Fast Green FCF (G3), 6: Brilliant Blue FCF (B1), 7: Erythrosine (R3)
Good separation of the seven components was obtained in 17 minutes for the 50 ug/mL standard (Figure 3).
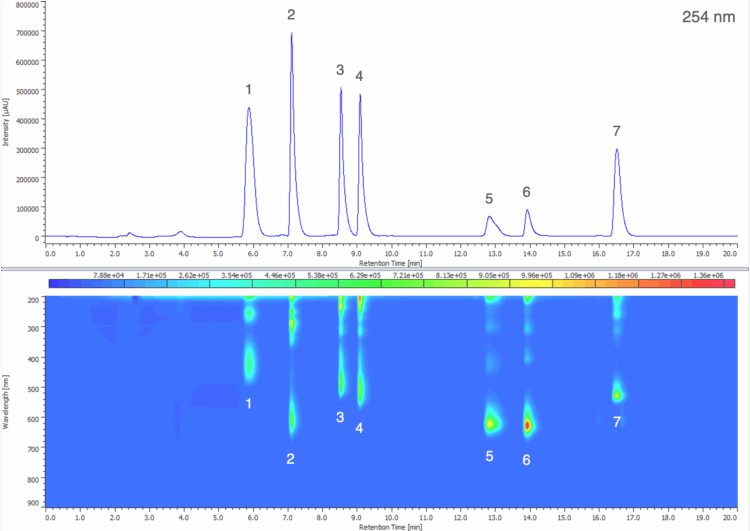
1: Tartrazine (Y5), 2: Indigo Carmine (B2), 3: Sunset Yellow FCF (Y6), 4: Allura Red AC (R40), 5: Fast Green FCF (G3), 6: Brilliant Blue FCF (B1), 7: Erythrosine (R3)
A maximum absorbance chromatogram displays the highest absorbance value recorded at each time point across the specified wavelength range and is useful for providing a clear overview of all chromophoric components in a sample, regardless of their wavelength. Figure 4 shows the maximum absorbance chromatogram from 240 – 900 nm of the 50 µg/mL standard solution.
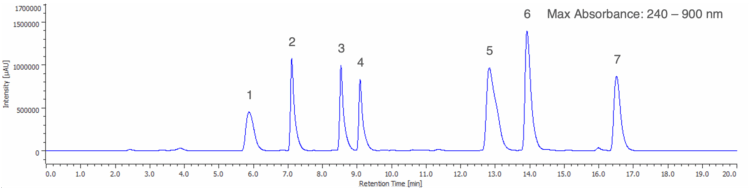
1: Tartrazine (Y5), 2: Indigo Carmine (B2), 3: Sunset Yellow FCF (Y6), 4: Allura Red AC (R40),
5: Fast Green FCF (G3), 6: Brilliant Blue FCF (B1), 7: Erythrosine (R3)
Figure 5 shows the corresponding peak-top spectrum from 200 – 900 nm of each peak in Figure 4. The spectra of the 7 components in the 50 µg/mL standard solution were registered in a spectral library, which will be used later for the identification of synthetic dyes in three unknown samples.
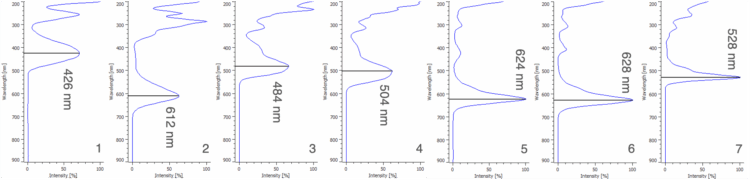
1: Tartrazine (Y5), 2: Indigo Carmine (B2), 3: Sunset Yellow FCF (Y6), 4: Allura Red AC (R40),
5: Fast Green FCF (G3), 6: Brilliant Blue FCF (B1), 7: Erythrosine (R3)
The wavelength of maximum absorbance, or lambda max (λmax), for each of the components in the 50 µg/mL standard solution was determined using the peak-top spectra shown in Figure 5. The λmax of each component (426, 612, 484, 504, 624, 628, and 528 nm) was used to extract seven chromatograms from the PDA data of each standard solution, corresponding to the seven synthetic dye standards. All seven calibration curves exhibit excellent linearity over the tested range, each with a correlation coefficient (R²) exceeding 0.9997. The linear regression equation obtained from each calibration curve was subsequently used to quantify the synthetic dyes in several unknown samples.
Table 1 shows the λmax and correlation coefficient for each synthetic dye calibration curve. Figure 6 shows the seven λmax extracted chromatograms from the 50 µg/mL standard solution.
Table 1. λmax and calibration curve correlation coefficients for the seven synthetic dyes in the standard solution
| Synthetic Dye Peak | λmax | Correlation Coefficient (R2) |
|---|---|---|
| Tartrazine (Y5) | 426 nm | 0.999988 |
| Indigo Carmine (B2) | 612 nm | 0.999880 |
| Sunset Yellow FCF (Y6) | 484 nm | 0.999977 |
| Allura Red AC (R40) | 504 nm | 0.999975 |
| Fast Green FCF (G3) | 624 nm | 0.999979 |
| Brilliant Blue FCF (B1) | 628 nm | 0.999776 |
| Erythrosine (R3) | 528 nm | 0.999970 |
Three unknown samples (a blue sports drink, a purple gelatin dessert, and a yellow freeze pop) were analyzed in triplicate under the same HPLC conditions as the standard solutions. The peak-top spectrum of each peak in the unknown samples were compared to a spectral library containing the spectra of each peak from the standard solution to identify which synthetic dyes were present in the unknown samples.
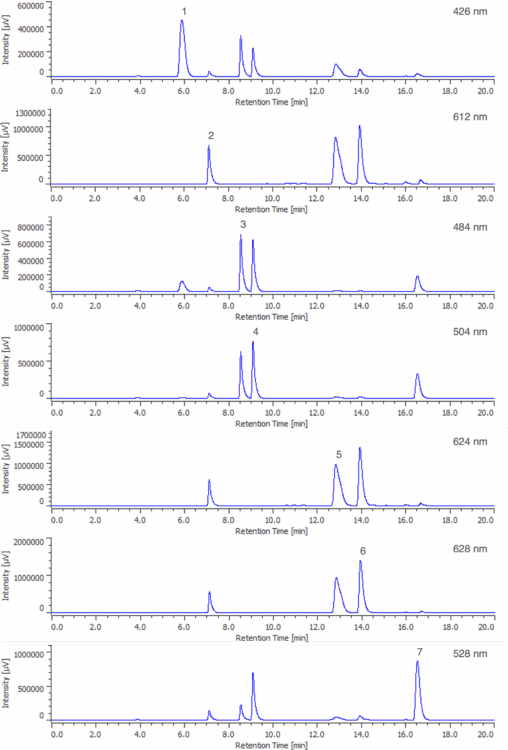
Figure 7A shows the chromatogram at 254 nm and PDA contour plot from 200 – 900 nm for an unknown blue sports drink. Figure 7B shows the peak-top spectrum of peak 1 from Figure 7A and the spectral library search result when compared to a spectral library containing the seven reference spectra obtained from the 50 µg/mL standard solution in Figure 5. Peak 1 shows a strong match to Brilliant Blue FCF (B1), with a correlation coefficient of 0.999167.
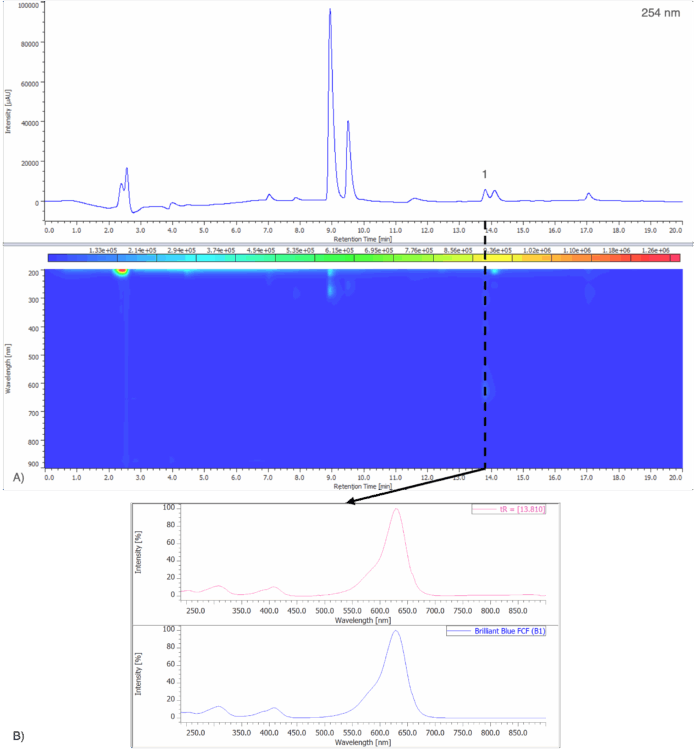
Figure 8A shows the chromatogram at 254 nm and PDA contour plot from 200 – 900 nm for an unknown purple gelatin dessert. Figure 8B shows the on-peak spectra of peaks 1 and 2 and their spectral library search result when compared to a spectral library containing the seven reference spectra obtained from the 50 µg/mL standard solution in Figure 5. Peak 1 shows a strong match to Indigo Carmine (B2), with a correlation coefficient of 0.999741. Peak 2 shows a strong match to Allura Red AC (R40) with a correlation coefficient of 0.998700.
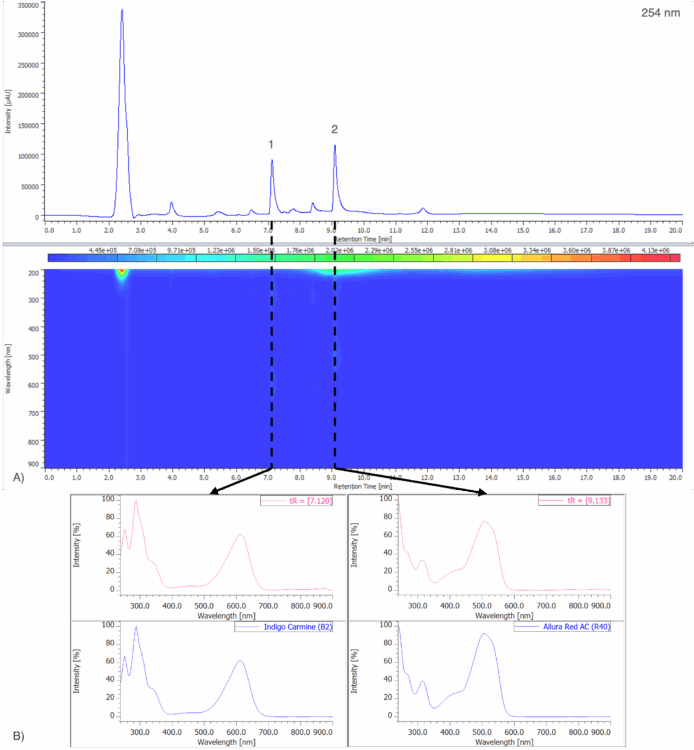
Figure 9A shows the chromatogram at 254 nm and PDA contour plot from 200 – 900 nm for an unknown yellow freeze pop. Figure 9B shows the peak-top spectra of peaks 1 and 2 and the spectral library search results when compared to a spectral library containing the seven reference spectra obtained from the 50 µg/mL standard solution in Figure 5. Peak 1 shows a strong match to Tartrazine (Y5), with a correlation coefficient of 0.999842. Peak 2 shows a strong match to Sunset Yellow FCF (Y6), with a correlation coefficient of 0.995832.
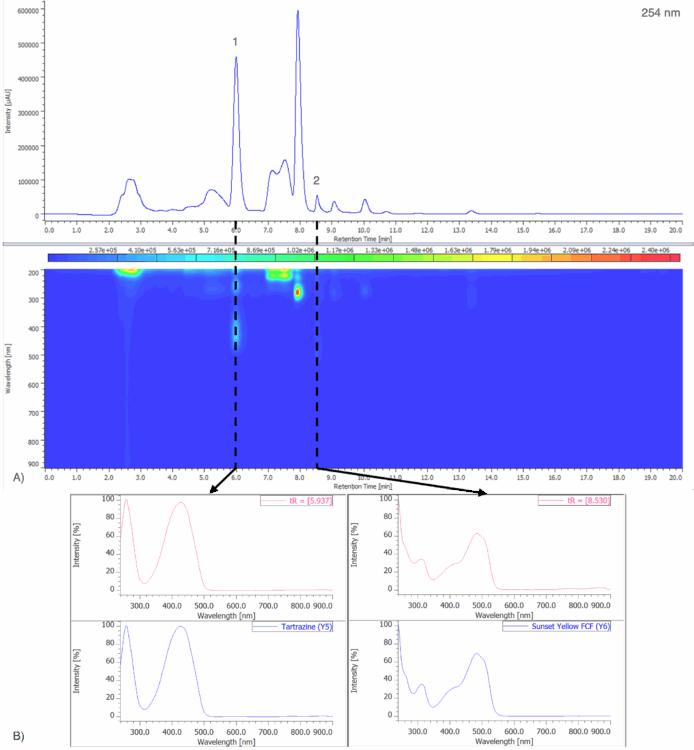
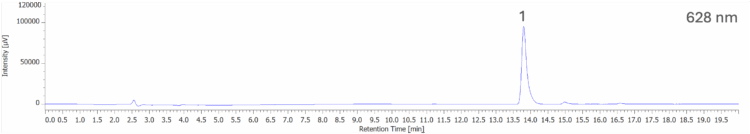
A chromatogram was extracted for the λmax of each synthetic dye that was identified in the spectral library search results of each unknown sample, resulting in a cleaner chromatogram to be used for more accurate quantification. Figures 10, 11, and 12 show the extracted λmax chromatograms for the unknown blue sports drink, purple gelatin dessert, and yellow freeze pop, respectively.
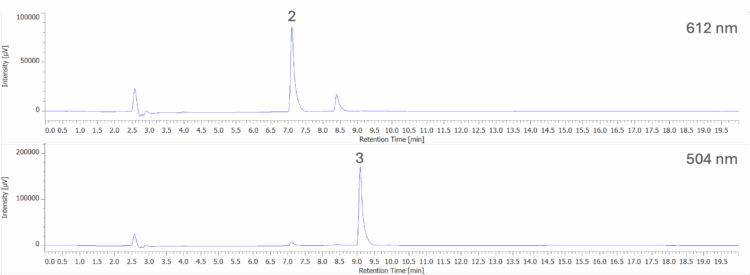
2: Indigo Carmine (B2); 3:Allura Red AC (R40)
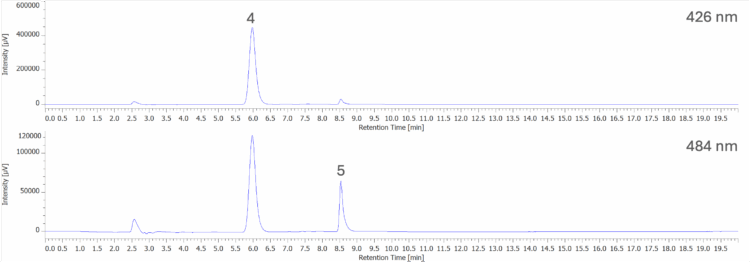
4: Tartrazine (Y5); 5: Sunset Yellow FCF (Y6)
For the blue sports drink, the peak corresponding to Brilliant Blue FCF (B1) in the chromatogram at 254 nm, Figure 7A, was difficult to quantify due to poor resolution caused by an overlapping peak; however, extracting the chromatogram at the λmax of B1 (628 nm), shown in Figure 10, isolates the peak for accurate quantification.
For each of the unknown samples, three replicate injections were used to calculate the average, standard deviation (SD), and relative standard deviation (RSD) of the peak area and concentration (µg/mL) using the ChromNAV Statistic Calculator. A summary of the peak area and concentration reproducibility for a blue sports drink, a purple gelatin dessert, and a yellow freeze pop are shown in Table 2, 3a, 3b, 4a, and 4b respectively.
Table 2. Blue sports drink (Brilliant Blue FCF, B1) peak area and concentration reproducibility
| Injection Number | Peak Area | Concentration (µg/mL) |
|---|---|---|
| 1 | 1,012,903 | 2.24133 |
| 2 | 1,011,793 | 2.23844 |
| 3 | 1,027,307 | 2.27874 |
| Average | 1,017,334 | 2.25284 |
| SD | 7,066.495 | 0.018356 |
| %RSD | 0.694609 | 0.814793 |
Table 3a. Purple gelatin dessert (Indigo Carmine, B2) peak area and concentration reproducibility
| Injection Number | Peak Area | Concentration (µg/mL) |
|---|---|---|
| 1 | 691,624 | 6.05450 |
| 2 | 683,491 | 5.98669 |
| 3 | 681,196 | 5.96756 |
| Average | 685,437 | 6.00292 |
| SD | 4474.363265 | 0.037300 |
| %RSD | 0.652775 | 0.621360 |
Table 3b. Purple gelatin dessert (Allura Red AC, R40) peak area and concentration reproducibility
| Injection Number | Peak Area | Concentration (µg/mL) |
|---|---|---|
| 1 | 1,367,481 | 8.65479 |
| 2 | 1,343,583 | 8.50247 |
| 3 | 1,339,725 | 8.47787 |
| Average | 1,350,263 | 8.54504 |
| SD | 12,276.216371 | 0.078251 |
| %RSD | 0.909172 | 0.915742 |
Table 4a. Yellow freeze pop (Tartrazine, Y5) peak area and concentration reproducibility
| Injection Number | Peak Area | Concentration (µg/mL) |
|---|---|---|
| 1 | 5,925,407 | 36.0363 |
| 2 | 5,965,366 | 36.2785 |
| 3 | 5,961,563 | 36.2554 |
| Average | 5,950,779 | 36.1901 |
| SD | 18,007.868 | 0.10916 |
| %RSD | 0.302614 | 0.301637 |
Table 4b. Yellow freeze pop (Sunset Yellow FCF, Y6) peak area and concentration reproducibility
| Injection Number | Peak Area | Concentration (µg/mL) |
|---|---|---|
| 1 | 500,048 | 4.23214 |
| 2 | 501,838 | 4.24777 |
| 3 | 502,418 | 4.25284 |
| Average | 501,435 | 4.24425 |
| SD | 1,008.739 | 0.00881 |
| %RSD | 0.201170 | 0.207561 |
The peak areas and concentrations of synthetic dyes in three unknown samples were determined with a %RSD of less than 1%. Based on the average of three replicate injections, the blue sports drink contained 2.25 µg/mL of Brilliant Blue FCF (B1), the purple gelatin dessert contained 6.00 µg/mL of Indigo Carmine (B2) and 8.55 µg/mL of Allura Red AC (R40), and the yellow freeze pop contained 36.19 µg/mL of Tartrazine (Y5) and 4.24 µg/mL of Sunset Yellow FCF (Y6).
Conclusion
HPLC with PDA detection are effective for the qualitative and quantitative analysis of petroleum-based synthetic dyes in foods and beverages. The method provides excellent chromatographic separation of seven components, confident spectral library matching (R² > 0.995), highly linear calibration curves (R² > 0.9997), and reproducible quantitation (RSD <1%). As the food and beverage industries transition away from synthetic dyes, this robust and reliable HPLC method can be used for a variety of complex matrices to offer manufacturers and quality control laboratories a powerful tool for supporting reformulation efforts, verifying product compliance, and ensuring consumer safety.
References
- Spence C. On the Relationship(s) Between Color and Taste/Flavor. Exp Psychol. 2019 Mar;66(2):99-111. doi: 10.1027/1618-3169/a000439. Epub 2019 Mar 21. PMID: 30895915; PMCID: PMC7037180.
- Miller MD, Steinmaus C, Golub MS, Castorina R, Thilakartne R, Bradman A, Marty MA. Potential impacts of synthetic food dyes on activity and attention in children: a review of the human and animal evidence. Environ Health. 2022 Apr 29;21(1):45. doi: 10.1186/s12940-022-00849-9. PMID: 35484553; PMCID: PMC9052604.
- U.S. Food and Drug Administration. (2025, January 15). FDA to Revoke Authorization for the Use of Red No. 3 in Food and Ingested Drugs [HFP Constituent Update]. https://www.fda.gov/food/hfp-constituent-updates/fda-revoke-authorization-use-red-no-3-food-and-ingested-drugs
- U.S. Food and Drug Administration. (2025, April 22). HHS, FDA to Phase Out Petroleum-Based Synthetic Dyes in Nation’s Food Supply [Press release]. https://www.fda.gov/news-events/press-announcements/hhs-fda-phase-out-petroleum-based-synthetic-dyes-nations-food-supply
- U.S. Food and Drug Administration. (2025, May 9). FDA Approves Three Food Colors from Natural Sources [Press release]. https://www.fda.gov/news-events/press-announcements/fda-approves-three-food-colors-natural-sources