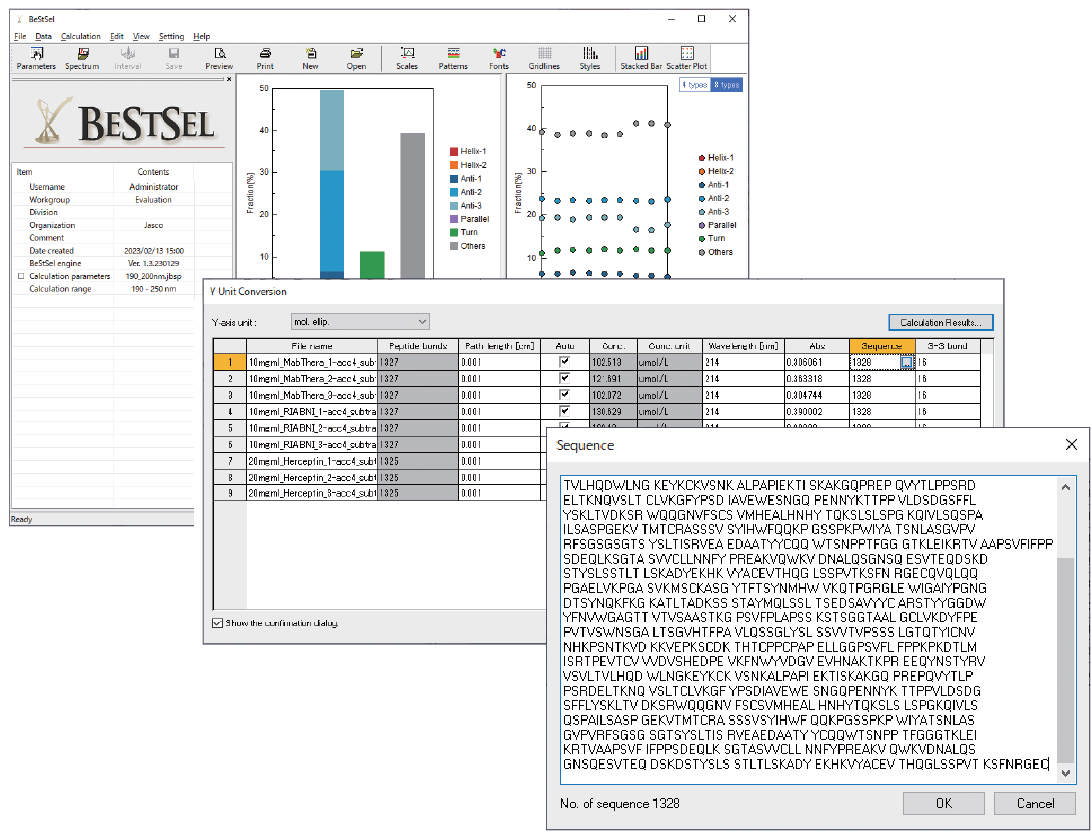
Spectra Manager BeStSel
The BeStSel algorithm accurately estimates protein secondary structure from the CD spectrum by considering the parallel-antiparallel orientation of the β-sheet and the twist of the antiparallel β-sheets. In total, BeStSel provides eight types of secondary structure information: 4 types of β-sheet, 2 types of α-helix, β-turn and other. This contrasts with previous estimation algorithms which typically used four types of secondary structure with a single component for β-sheet estimation. The BeStSel method yields high estimation accuracy for a wide range of proteins, particularly β-structure-rich-proteins such as antibodies. Find out more.
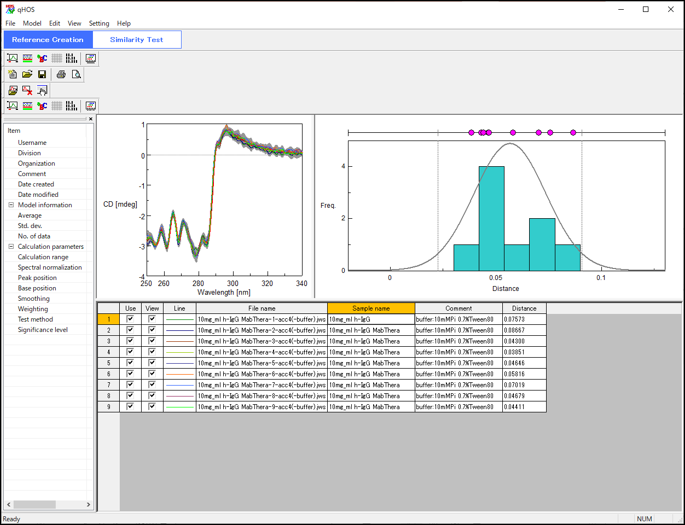 qHOS Higher Order Structure Analysis Program
Orthogonal Assessment of protein secondary and tertiary Structure.
The qHOS spectral comparison program is capable of evaluating secondary structure similarity of proteins using circular dichroism and FTIR, and tertiary structure by circular dichroism and Raman. Find out more.
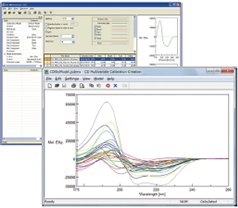
Multivariate Secondary Structure Analysis Program
Quantitative multivariate analysis (PCR/PLS) program for the estimation of protein secondary structures from CD spectra. The reference data set supplied includes 26 proteins and is flexible to allow the user to add additional proteins as desired or even create an entirely new reference data set.
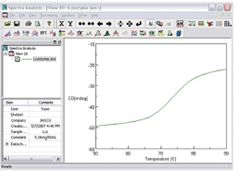
Denatured Protein Analysis Program
Enables calculation of the thermodynamic parameters (Tm, ΔH, ΔS) of protein from the data with variable temperatures.
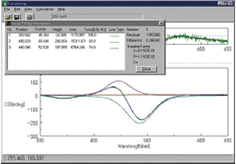
Curve Fitting Program
Curve fitting is a method used to resolve multiple components by finding the heights, widths and positions of overlapping bands contained in a spectrum and using a variety of regression algorithms including variable bandwidths.
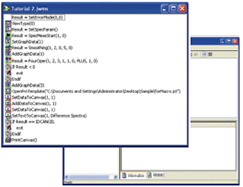
Macro Command Program
Allows full automation from data measurement to complete analysis and presentation using pre-set customizable templates in the JASCO Canvas program.

