Analysis of Chondroitin Sulfate by Size Exclusion Chromatography
January 5, 2024
 Download This Application
Introduction
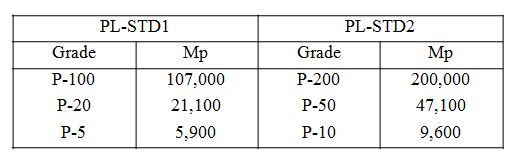
There are several types (A to E) of chondroitin sulfate (MW 20,000 ~ 50,000) (one of which is a mucopolysaccharide) which are found in animal connective tissue – cartilage and skin. Chondroitin sulfate is widely used in the manufacture of health foods and medicines. In this application note Chondroitin sulfate (sodium salt) was analyzed using a SEC (size exclusion chromatography) column with an exclusion limit of 300,000 molecular weight (Pullulan) and detection using refractive index (RI detector). A Pullulan calibration curve was created from a standard mixture using ChromNAV with the optional GPC Calculation Program and the resulting molecular weights calculated from the Pullulan standard are described below.
Experimental
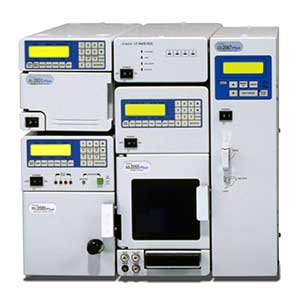
Experiment
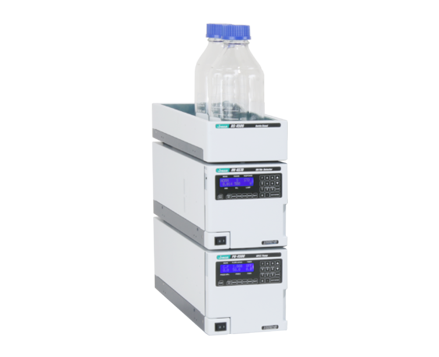
| Pump: | PU-2080 |
| Degasser: | DG-2080-53 |
| Column Oven: | CO-2060 |
| Autosampler: | AS-2057 |
| Detector: | RI-2031 |
Conditions
| Column: | Shodex Asahipak GF-510 HQ (7.5 mmI.D. x 300 mmL, 5 µm) |
| Eluent: | 0.04 M Sodium dihydrogen phosphate anhydrous- 0.06 M Disodium hydrogen phosphate anhydrous |
| Flow Rate: | 0.6 mL/min |
| Column Temp.: | 30 ºC |
| Injection Volume: | 50 µL |
| Calibration standards for SEC: | Shodex STANDARD P-82 (Pullulan) 0.05 % each eluent |
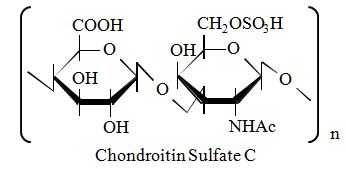
Structure
Keywords
610062G, HPLC, size exclusion, chondroitin sulfate, SEC, RI detector, GPC Calculation, molecular weight
Results
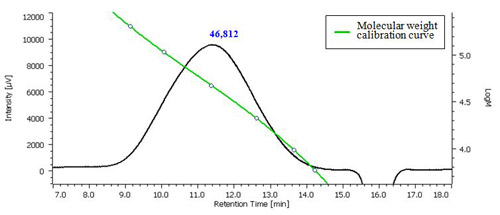
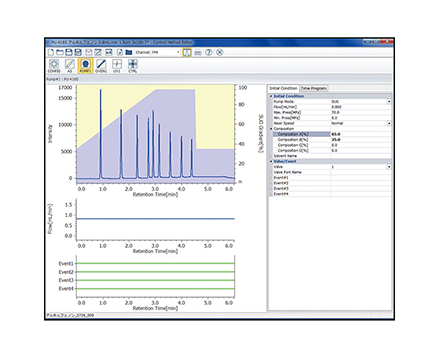
Fig. 1 Chromatograms of Pullulan (PL) standard mixture for molecular weight calibration and chondroitin sulfate sodium salt.
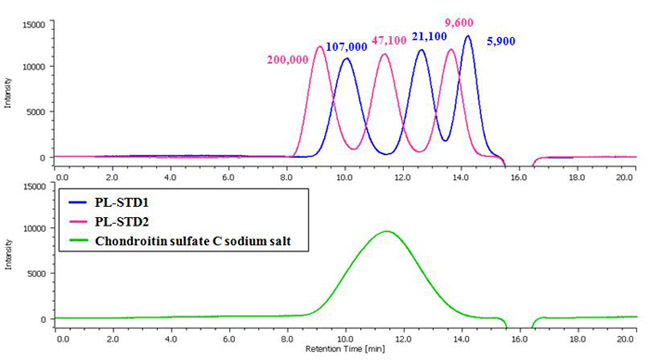
Chondroitin Sulfate Sodium Salt (Each value on the chromatograms is Mp (Peak top molecular weight).)
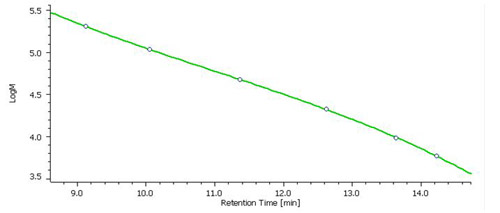
Fig. 2 Molecular weight calibration curve created with a mixed Pullulan standard.
Fig. 3 Chromatogram of chondroitin sulfate sodium salt and the molecular weight calibration curve.
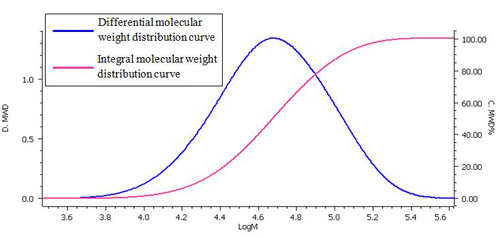
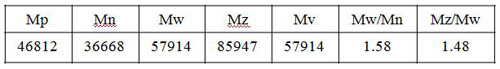
Fig. 4 and Table 1 show the molecular weight distribution calculation curve and the molecular weight as calculated using a Pullulan standard.
Hint
Molecular weight calibration curve
Shows the relationship between retention volume (elution time) and molecular weight, which is created to estimate the molecular weight of the sample from its retention volume (elution time).
Molecular weight distribution curve
The integral molecular weight distribution curve shows the relationship between molecular weight (logarithmic value) and the percentage of the total of a specific molecular weight.
The differential molecular weight distribution curve is used to plot the molecular weight (logarithmic value) on the x-axis against the weight fraction differentiated from a logarithmic value of molecular weight (dw/d(logM)) on the y-axis. When normalized, the use of this curve makes it possible to compare a chromatogram and a molecular weight distribution derived using different columns and measurement conditions.
Molecular weight averages and polydispersity
The molecular weight averages of polymer materials obtained by size exclusion chromatography (SEC) includes the number-average (Mn), weight average (Mw), z-average (Mz), and viscosity-average (Mv) molecular weights. These averages are defined by the following expressions. The distribution of these molecular weight averages bears in general a relationship such as Mn ? Mv ? Mw ? Mz. In the case where Mn = Mv = Mw = Mz, there is no molecular weight distribution (mono-dispersed).
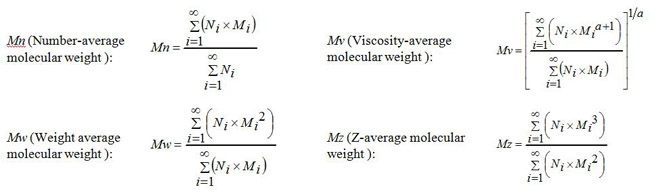
and a represents an index of Mark-Houwink-Sakurada equation.
Featured Products:

Analysis of Chondroitin Sulfate by Size Exclusion Chromatography
Introduction
There are several types (A to E) of chondroitin sulfate (MW 20,000 ~ 50,000) (one of which is a mucopolysaccharide) which are found in animal connective tissue – cartilage and skin. Chondroitin sulfate is widely used in the manufacture of health foods and medicines. In this application note Chondroitin sulfate (sodium salt) was analyzed using a SEC (size exclusion chromatography) column with an exclusion limit of 300,000 molecular weight (Pullulan) and detection using refractive index (RI detector). A Pullulan calibration curve was created from a standard mixture using ChromNAV with the optional GPC Calculation Program and the resulting molecular weights calculated from the Pullulan standard are described below.
Experimental
Experiment
| Pump: | PU-2080 |
| Degasser: | DG-2080-53 |
| Column Oven: | CO-2060 |
| Autosampler: | AS-2057 |
| Detector: | RI-2031 |
Conditions
| Column: | Shodex Asahipak GF-510 HQ (7.5 mmI.D. x 300 mmL, 5 µm) |
| Eluent: | 0.04 M Sodium dihydrogen phosphate anhydrous- 0.06 M Disodium hydrogen phosphate anhydrous |
| Flow Rate: | 0.6 mL/min |
| Column Temp.: | 30 ºC |
| Injection Volume: | 50 µL |
| Calibration standards for SEC: | Shodex STANDARD P-82 (Pullulan) 0.05 % each eluent |
Structure
Results
Fig. 1 Chromatograms of Pullulan (PL) standard mixture for molecular weight calibration and chondroitin sulfate sodium salt.
Chondroitin Sulfate Sodium Salt (Each value on the chromatograms is Mp (Peak top molecular weight).)
Fig. 2 Molecular weight calibration curve created with a mixed Pullulan standard.
Fig. 3 Chromatogram of chondroitin sulfate sodium salt and the molecular weight calibration curve.
Fig. 4 and Table 1 show the molecular weight distribution calculation curve and the molecular weight as calculated using a Pullulan standard.
Hint
Molecular weight calibration curve
Shows the relationship between retention volume (elution time) and molecular weight, which is created to estimate the molecular weight of the sample from its retention volume (elution time).
Molecular weight distribution curve
The integral molecular weight distribution curve shows the relationship between molecular weight (logarithmic value) and the percentage of the total of a specific molecular weight.
The differential molecular weight distribution curve is used to plot the molecular weight (logarithmic value) on the x-axis against the weight fraction differentiated from a logarithmic value of molecular weight (dw/d(logM)) on the y-axis. When normalized, the use of this curve makes it possible to compare a chromatogram and a molecular weight distribution derived using different columns and measurement conditions.
Molecular weight averages and polydispersity
The molecular weight averages of polymer materials obtained by size exclusion chromatography (SEC) includes the number-average (Mn), weight average (Mw), z-average (Mz), and viscosity-average (Mv) molecular weights. These averages are defined by the following expressions. The distribution of these molecular weight averages bears in general a relationship such as Mn ? Mv ? Mw ? Mz. In the case where Mn = Mv = Mw = Mz, there is no molecular weight distribution (mono-dispersed).
and a represents an index of Mark-Houwink-Sakurada equation.
Keywords
610062G, HPLC, size exclusion, chondroitin sulfate, SEC, RI detector, GPC Calculation, molecular weight