CD Spectra Measurements of Organic Compounds and Metal-Complexes using a One Drop Accessory with Microsampling Disc
January 5, 2024
 Download This Application
Introduction
While CD measurements are typically obtained to analyze the secondary structure of proteins, CD can also be used to determine the configuration of organic compounds and coordination of metal complexes with optically active ligands.
This application note will compare CD spectra obtained using the OneDrop microsampling disc with a conventional cell, for organic compounds with an absorption band in the ultraviolet (UV) region and metal complexes with an absorption band in the UV and Visible regions.
Experimental
| Measurement conditions for organic compounds (Figure 1) J-1500 CD spectrometer, MSD, conventional cell | |
|---|---|
| Spectral bandwidth | 1 nm |
| Accumulation | 4 times (MSD), 1 time (conventional cell) |
| Data acquisition interval | 0.1 nm |
| Response time | 2 seconds |
| Scan speed | 100 nm/min |
| Sample volume | 10 µL (MSD), 400 µL (conventional cell) |
| Path length | 1 mm |
| Measurement conditions for metal complexes (Figure 2) J-1500 CD spectrometer, MSD, conventional cell | |
|---|---|
| Spectral bandwidth | 1 nm |
| Accumulation | 9 times (MSD), 1 time (conventional cell) |
| Data acquisition interval | 0.1 nm |
| Response time | 2 seconds |
| Scan speed | 200 nm/min |
| Sample volume | 10 µL (MSD), 400 µL (conventional cell) |
| Path length | 1 mm |
Keywords
180-CD-0012, One Drop measurement, microsampling disc, Circular Dichroism, CD, organic compounds, metal complexes, J-1500
Results
The CD spectra depicted in Figures 1 and 2 compare the results obtained using the MSD and a conventional cell for organic compounds and metal complexes, respectively. Both the organic compounds and metal complexes’ data show good correlation between spectra measured with the 10 µL volume microsampling disk (blue) and 400 µL volume conventional cell (green), each with a 1 mm path length.
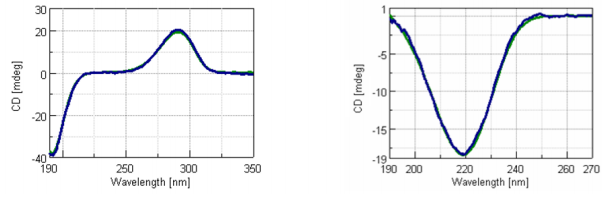
Figure 1. CD spectra of (A) (1S)-(+)-10-Camphorsulfonid acid, ammounium salt and (B) D-Pantolactone using a microsampling disk (blue) and cylindrical cell (green).
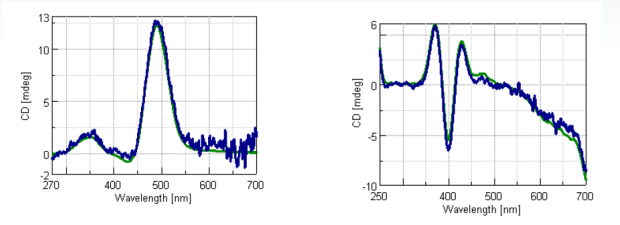
Figure 2. CD spectra of (A) 2(+)D-[Coen3]Cl3NaCl-6H2O and (B) 0.25 M NiSO4+, 0.36 M Rochelle salt using a microsampling disk (blue) and cylindrical cell (green).
Conclusion
This application note demonstrates that the OneDrop microsampling disk provides reliable spectra for CD spectroscopy measurements in volume-limited samples
Featured Products:

CD Spectra Measurements of Organic Compounds and Metal-Complexes using a One Drop Accessory with Microsampling Disc
Introduction
While CD measurements are typically obtained to analyze the secondary structure of proteins, CD can also be used to determine the configuration of organic compounds and coordination of metal complexes with optically active ligands.
This application note will compare CD spectra obtained using the OneDrop microsampling disc with a conventional cell, for organic compounds with an absorption band in the ultraviolet (UV) region and metal complexes with an absorption band in the UV and Visible regions.
Experimental
| Measurement conditions for organic compounds (Figure 1) J-1500 CD spectrometer, MSD, conventional cell | |
|---|---|
| Spectral bandwidth | 1 nm |
| Accumulation | 4 times (MSD), 1 time (conventional cell) |
| Data acquisition interval | 0.1 nm |
| Response time | 2 seconds |
| Scan speed | 100 nm/min |
| Sample volume | 10 µL (MSD), 400 µL (conventional cell) |
| Path length | 1 mm |
| Measurement conditions for metal complexes (Figure 2) J-1500 CD spectrometer, MSD, conventional cell | |
|---|---|
| Spectral bandwidth | 1 nm |
| Accumulation | 9 times (MSD), 1 time (conventional cell) |
| Data acquisition interval | 0.1 nm |
| Response time | 2 seconds |
| Scan speed | 200 nm/min |
| Sample volume | 10 µL (MSD), 400 µL (conventional cell) |
| Path length | 1 mm |
Results
The CD spectra depicted in Figures 1 and 2 compare the results obtained using the MSD and a conventional cell for organic compounds and metal complexes, respectively. Both the organic compounds and metal complexes’ data show good correlation between spectra measured with the 10 µL volume microsampling disk (blue) and 400 µL volume conventional cell (green), each with a 1 mm path length.
Figure 1. CD spectra of (A) (1S)-(+)-10-Camphorsulfonid acid, ammounium salt and (B) D-Pantolactone using a microsampling disk (blue) and cylindrical cell (green).
Figure 2. CD spectra of (A) 2(+)D-[Coen3]Cl3NaCl-6H2O and (B) 0.25 M NiSO4+, 0.36 M Rochelle salt using a microsampling disk (blue) and cylindrical cell (green).
Conclusion
This application note demonstrates that the OneDrop microsampling disk provides reliable spectra for CD spectroscopy measurements in volume-limited samples
Keywords
180-CD-0012, One Drop measurement, microsampling disc, Circular Dichroism, CD, organic compounds, metal complexes, J-1500