CD Spectrum Measurement Using HTCD System
August 24, 2022
 Download This Application
Introduction
Automatic measurement systems have been drawing increasing attention among pharmaceuticals companies due to their ability to analyse multiple samples automatically, saving both time and man power and eliminating any possible human error. Since CD spectroscopy allows the user to easily obtain structural information about proteins and peptides, automated measurement systems can be used to optimize the screening process of a large number of samples.
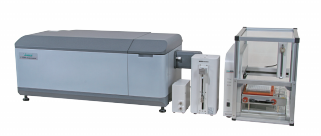
This application notes introduces the High-Throughput CD system for automatic CD measurements of multiple protein samples.
Experimental
| Measurement conditions | |||
|---|---|---|---|
| Data acquisition interval | 0.1 nm | Response time | 2 seconds |
| Spectral bandwidth | 1 nm | Scan speed | 100 nm/min |
| Accumulations | 4 times | Path length | 1 mm |
| Emission wavelength | 350 nm | Sensitivity | 850 V |
Keywords
J-1500, circular dichroism, Autosampler, ASU-800, FMO- 427, Emission monochromator, excitation, emission, HighThroughput, HTCD, proteins, biochemistry, pharmaceuticals
Results
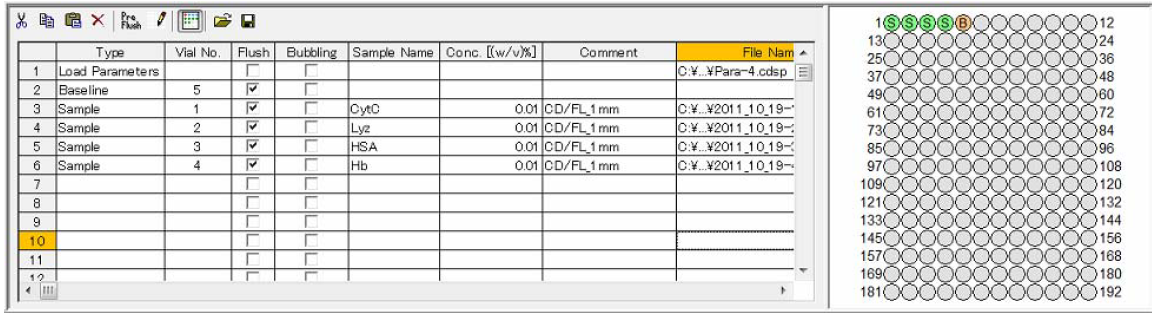
First the sequence of operation and data acquisition must be defined in advance. The maximum number of samples that can be analyzed automatically is 192. The system will then carry out CD measurements automatically and save the data series. The following sequence is automatically performed by the HTCD system:
1. Loading of measurement condition
2. Baseline correction
3. Sample 1 measurement (cytochrome c)
4. Washing
5. Sample 2 measurement (lysozyme)
6. Washing
7. Sample 3 measurement (human serum albumin)
8. Washing
9. Sample 4 measurement (hemoglobin)
10. Washing
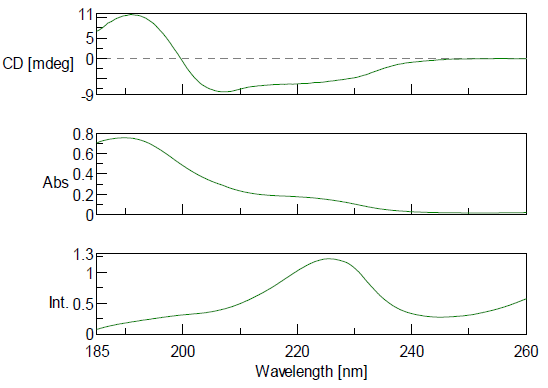
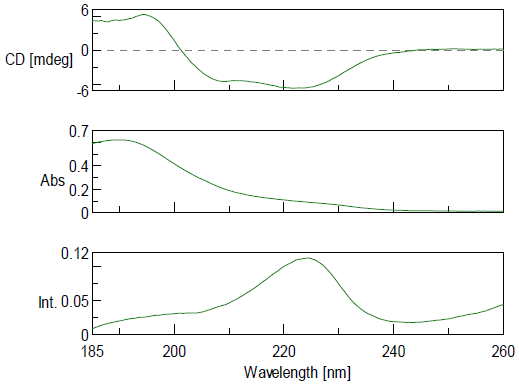
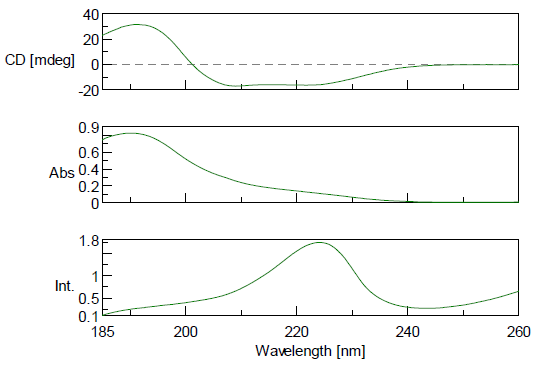
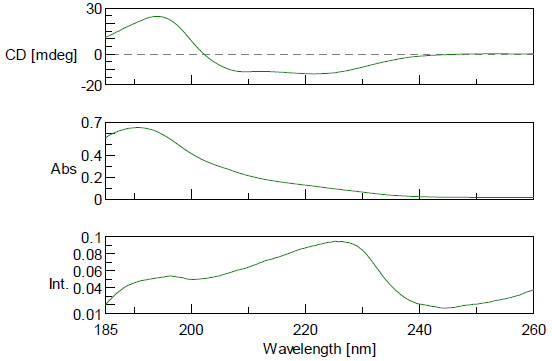
The JFLC-499 CD/emission flow cell was used to obtain both CD and excitation spectra. The results of the automatic measurements of CD, absorbance, and excitation spectra for four 0.1 mg/mL protein samples are shown below. These high speed measurements took a total of 3 minutes per sample (each scan is 45 seconds and there are 4 accumulations).
Conclusion
This application note demonstrates that high quality data can be measured for three different spectroscopy techniques (CD, absorption, and excitation) in a matter of minutes. The J-1500 coupled with the HTCD system allows over 100 samples to be measured automatically without human operation, saving time and eliminating human error.
Featured Products:
-
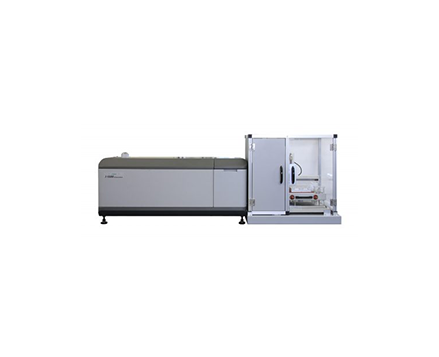
Automated HTCD
-
Automated high-throughput screening system for use with the J-1500/1700.
High-Throughput CD
-
Highest performance with a wide range of accessories for maximum flexibility to meet complex research demands.
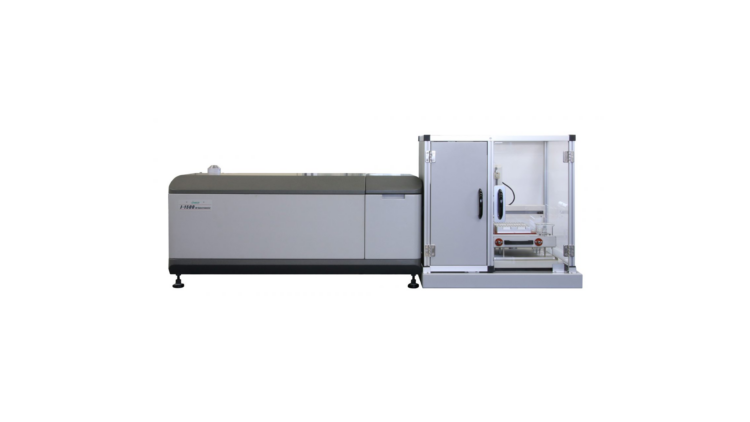
J-1500
-
UV/Visible/NIR measurements up to 2,500 nm for MCD and specialized applications.
J-1700

CD Spectrum Measurement Using HTCD System
Introduction
Automatic measurement systems have been drawing increasing attention among pharmaceuticals companies due to their ability to analyse multiple samples automatically, saving both time and man power and eliminating any possible human error. Since CD spectroscopy allows the user to easily obtain structural information about proteins and peptides, automated measurement systems can be used to optimize the screening process of a large number of samples.
This application notes introduces the High-Throughput CD system for automatic CD measurements of multiple protein samples.
Experimental
| Measurement conditions | |||
|---|---|---|---|
| Data acquisition interval | 0.1 nm | Response time | 2 seconds |
| Spectral bandwidth | 1 nm | Scan speed | 100 nm/min |
| Accumulations | 4 times | Path length | 1 mm |
| Emission wavelength | 350 nm | Sensitivity | 850 V |
Results
First the sequence of operation and data acquisition must be defined in advance. The maximum number of samples that can be analyzed automatically is 192. The system will then carry out CD measurements automatically and save the data series. The following sequence is automatically performed by the HTCD system:
1. Loading of measurement condition
2. Baseline correction
3. Sample 1 measurement (cytochrome c)
4. Washing
5. Sample 2 measurement (lysozyme)
6. Washing
7. Sample 3 measurement (human serum albumin)
8. Washing
9. Sample 4 measurement (hemoglobin)
10. Washing
The JFLC-499 CD/emission flow cell was used to obtain both CD and excitation spectra. The results of the automatic measurements of CD, absorbance, and excitation spectra for four 0.1 mg/mL protein samples are shown below. These high speed measurements took a total of 3 minutes per sample (each scan is 45 seconds and there are 4 accumulations).
Conclusion
This application note demonstrates that high quality data can be measured for three different spectroscopy techniques (CD, absorption, and excitation) in a matter of minutes. The J-1500 coupled with the HTCD system allows over 100 samples to be measured automatically without human operation, saving time and eliminating human error.
Keywords
J-1500, circular dichroism, Autosampler, ASU-800, FMO- 427, Emission monochromator, excitation, emission, HighThroughput, HTCD, proteins, biochemistry, pharmaceuticals