Change in the Fluorescence Anisotropy Spectrum by the Denaturation of α-lactalbumin
January 5, 2024
 Download This Application
Introduction
Circular Dichroism spectroscopy is one of the leading techniques in protein structure analysis, with fluorescence spectroscopy and fluorescence anisotropy both providing complementary information. While CD spectra provide information regarding the secondary structure of proteins, fluorescence spectra and anisotropy provide information about the local environment surrounding the fluorophores. In particular, fluorescence anisotropy provides additional information about the rotational movement of these fluorophores which cannot be obtained by fluorescence spectroscopy alone.
The JASCO J-1500 CD spectrometer can be used to measure spectra for CD, absorption, fluorescence excitation and emission, and fluorescence anisotropy. This variety of techniques not only allows for secondary structure estimation but also the analysis of protein-ligand binding and rotational movement in proteins.
This application note describes the changes in fluorescence anisotropy measurements during the denaturation of α-lactalbumin by guanadinium hydrochloride (GuHCl).
Experimental
| Measurement conditions | |
|---|---|
| Data acquisition interval | 0.1 nm |
| Excitation bandwidth | 7 nm |
| Response time | 4 times |
| Response time | 2 sec |
| Scan speed | 100 nm |
Keywords
210-CD-0032, J-1500, circular dichroism, CDF-426, fluorescence, anisotropy, α-lactalbumin, GuHCl, secondary structure, denaturation, biochemistry
Results
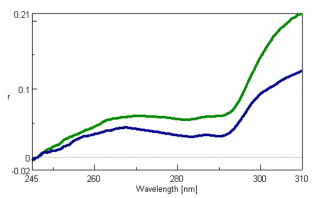
The fluorescence anisotropy spectra of both the native-state α-lactalbumin in H2O and the unfolded α-lactalbumin in 3.4 M GuHCl are shown in Figure 1. Both spectra show a peak maxima at 267 nm and peak minima at 283 and 291 nm. All three peaks result from the tryptophan residue of the protein. Figure 1 illustrates that the denaturation of α-lactalbumin clearly decreases the fluorescence anisotropy, indicating a more freely rotating tryptophan residue.
Conclusion
This application note demonstrates that the J-1500 CD spectrometer can be used to measure samples for a variety of spectroscopic techniques. The addition of the FPA-580 polarizer to the J-1500 spectrometer allows users to obtain CD and fluorescence anisotropy data all on the same instrument.
References
1. Canet, D., Doering, K., Dobson, C. M., and Y. Dupont, Biophysical Journal (2001), 80, 1996-2003.
2. J. R. Lakowicz, Principles of Fluorescence Spectroscopy, New York, 446-487.
Featured Products:

Change in the Fluorescence Anisotropy Spectrum by the Denaturation of α-lactalbumin
Introduction
Circular Dichroism spectroscopy is one of the leading techniques in protein structure analysis, with fluorescence spectroscopy and fluorescence anisotropy both providing complementary information. While CD spectra provide information regarding the secondary structure of proteins, fluorescence spectra and anisotropy provide information about the local environment surrounding the fluorophores. In particular, fluorescence anisotropy provides additional information about the rotational movement of these fluorophores which cannot be obtained by fluorescence spectroscopy alone.
The JASCO J-1500 CD spectrometer can be used to measure spectra for CD, absorption, fluorescence excitation and emission, and fluorescence anisotropy. This variety of techniques not only allows for secondary structure estimation but also the analysis of protein-ligand binding and rotational movement in proteins.
This application note describes the changes in fluorescence anisotropy measurements during the denaturation of α-lactalbumin by guanadinium hydrochloride (GuHCl).
Experimental
| Measurement conditions | |
|---|---|
| Data acquisition interval | 0.1 nm |
| Excitation bandwidth | 7 nm |
| Response time | 4 times |
| Response time | 2 sec |
| Scan speed | 100 nm |
Results
The fluorescence anisotropy spectra of both the native-state α-lactalbumin in H2O and the unfolded α-lactalbumin in 3.4 M GuHCl are shown in Figure 1. Both spectra show a peak maxima at 267 nm and peak minima at 283 and 291 nm. All three peaks result from the tryptophan residue of the protein. Figure 1 illustrates that the denaturation of α-lactalbumin clearly decreases the fluorescence anisotropy, indicating a more freely rotating tryptophan residue.
Conclusion
This application note demonstrates that the J-1500 CD spectrometer can be used to measure samples for a variety of spectroscopic techniques. The addition of the FPA-580 polarizer to the J-1500 spectrometer allows users to obtain CD and fluorescence anisotropy data all on the same instrument.
Keywords
210-CD-0032, J-1500, circular dichroism, CDF-426, fluorescence, anisotropy, α-lactalbumin, GuHCl, secondary structure, denaturation, biochemistry
References
1. Canet, D., Doering, K., Dobson, C. M., and Y. Dupont, Biophysical Journal (2001), 80, 1996-2003.
2. J. R. Lakowicz, Principles of Fluorescence Spectroscopy, New York, 446-487.