Highly Sensitive and Comprehensive Detection for Chiral Separation of Pesticide using SFC-CD-MS
January 5, 2024
 Download This Application
Introduction
In this study, we developed a new method for the chiral separation of pesticides using SFC-CD-MS, with a circular dichroism detector (CD) and mass spectrometer (MS). Around 30% of pesticides currently used worldwide are chiral isomers with one or more chiral centers. It is well known that the enantiomers of chiral pesticides have different biological activities, toxicity on non-targeted organisms, rate of metabolism, and biodegradation in the environment. Although it is desirable to use the more effective and safer enantiomers, most chiral pesticides are marketed and used as racemates due to the complicated process and high cost of manufacturing a single enantiomer molecule.
In general, chiral separation by HPLC, GC, and SFC has been one of the most important ways for analyzing the synthetic approach to individual enantiomers. Although HPLC still dominates chromatographic chiral analysis because of its ease of use, SFC has advantages such as shorter analysis time and significant reduction in solvent consumption and cost.
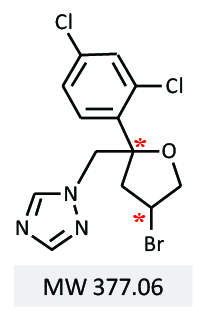
A CD detector simultaneously provides circular dichroism and UV absorbance data, and enables selective identification of the CD polarity of each enantiomer. MS spectra are used to distinguish between chiral isomer groups with the same m/z from other components including impurities. Highly sensitive and comprehensive detection with UV, CD, and MS contributes to the widely applicable and highly accurate analysis for chiral separation in the efficient development of a single enantiomer pesticide. The system and chiral separation method described here is applicable to many industries that deal with chiral compounds. In this presentation, we will present the application of SFC to bromuconazole, a type of triazole fungicide (Figure 1).
Experimental
Apparatus
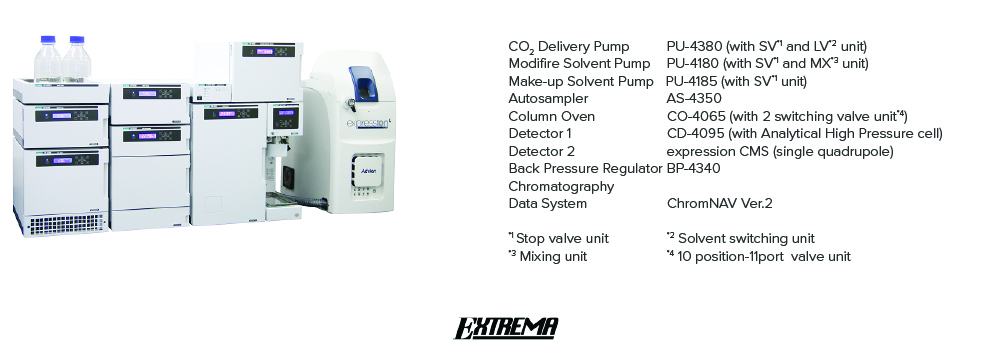
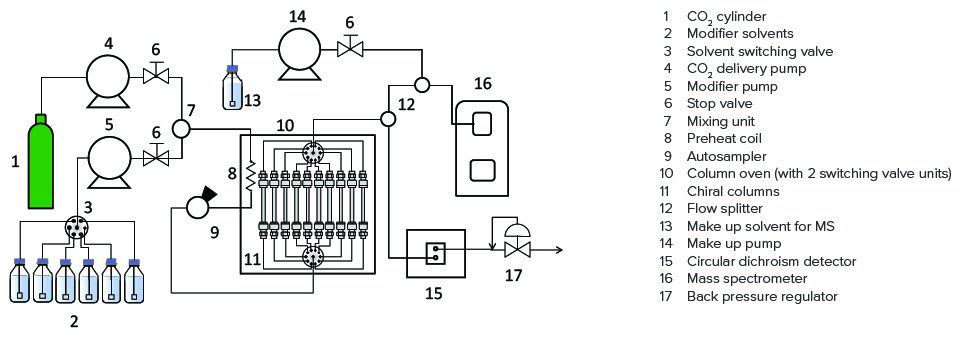
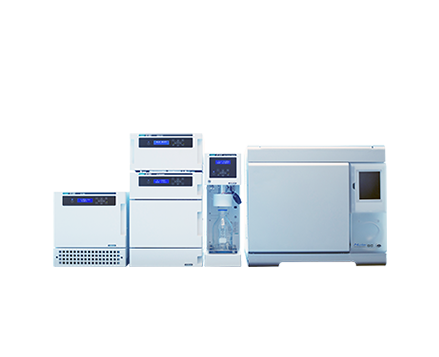
Figure 2 details the JASCO SFC-CD-MS system used in this experiment, together with Figure 3 that shows the schematic diagram of the system. Using a splitter with a PEEK-coated capillary tube, the flow from a chiral column is divided into two channels, one each to the CD and MS detectors. The CD detector provide the CD and UV signals simultaneously. This system enables automated method scouting analysis to be performed on mobile phases and columns.
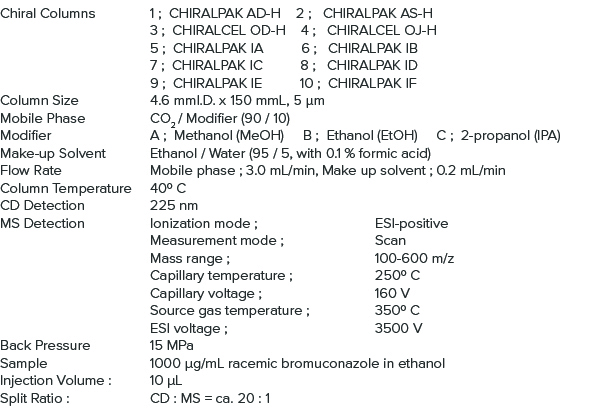
Analysis Conditions for Method Scouting
Keywords
101022U
Results
Results of Method Scouting on Mobile Phases and Columns
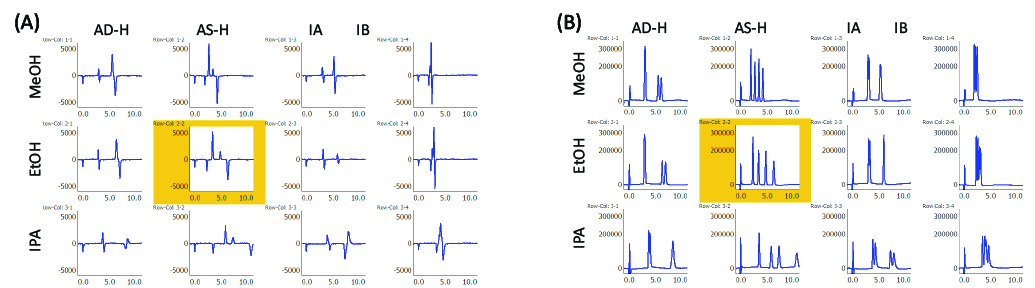
Racemic bromuconazole with 2 chiral centers can be separated into 4 isomer peaks using a chiral column. Figure 4 shows the selected results of method scouting analysis for mobile phases and columns. The best separation was observed with the combination of ethanol and CHIRALPAK AS-H (highlighted in yellow). This separation condition was used in the following experiments.
Comprehensive Detection by CD and MS Detectors
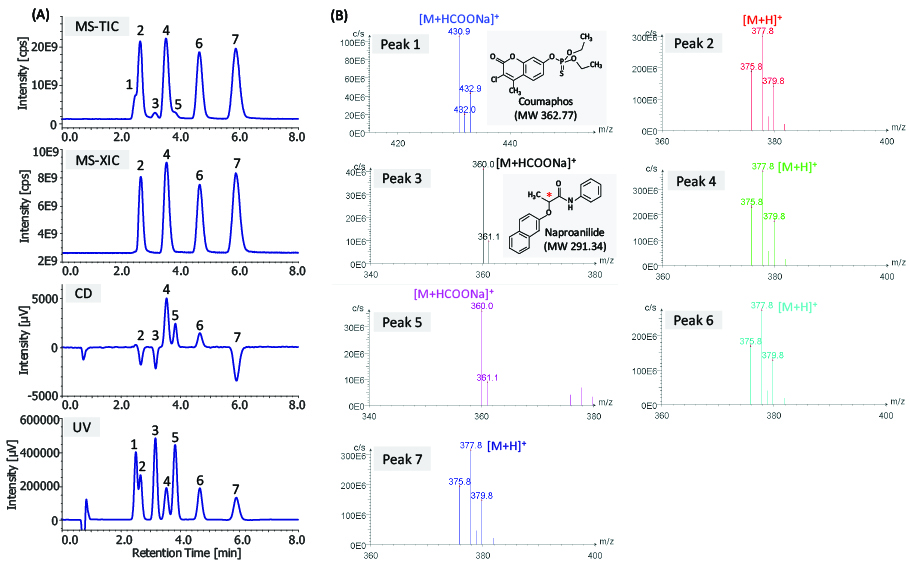
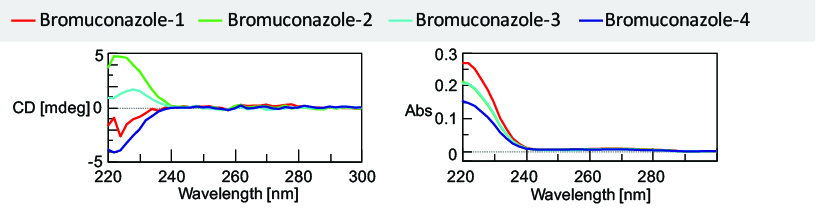
Figure 5 shows the results of a bromuconazole standard spiked with two additional pesticides, coumaphos and naproanilide, as contaminants detected by CD and MS detectors. Figure 5A shows the total ion chromatogram (TIC) from 100 to 600 m/z, extracted ion chromatogram (XIC) of m/z 378.0, CD and UV chromatograms. Figure 5B shows the MS spectra of each peak described in Figure 5A. As shown in this figure, we can clearly discriminate the bromuconazole isomers and other contaminants. Bromuconazole isomers (peaks 2, 4, 6, and 7) have similarities in their spectra, and a protonated molecular ion ([M+H]+) was observed at m/z 377.8 as a base peak in the mass spectrum of each isomer peak. Sodium formate adduct ions ([M+HCOONa]+) of coumaphos and naproanilide are also observed at m/z 430.9 (peak 1) and m/z 360.0 (peaks 3 and 5). Figure 6 shows the stopped-flow scanned spectra of CD and UV for bromuconazole standard peaks. In the spectral measurements, a 2-position 6-port switching valve is used in order to divert the flow and ‘park’ each peak in the flow cell for stopped flow measurement. The spectra of bromuconazole-1, 2, 3, and 4 correspond to peaks 2, 4, 6, and 7 in Figure 5A, respectively. According to the CD information in Figure 5A and Figure 6, peaks 2 and 6 of the bromuconazole isomers are estimated to be an enantiomeric pair from their CD polarity and maximum wavelength. Peak 4 and 7 are also the same.
In this way, comprehensive detection by CD and MS detectors is useful to identify the target chiral isomers group and other contaminants with chiral separation.
Linearity, Reproducibility and Sensitivity
Figure 7 shows the overlaid chromatograms of SIM (Single Ion Monitoring) at m/z 378.0, CD, and UV of bromuconazole standards (SIM: 0.025, 0.125, and 0.25 µg/mL, CD: 62.5, 250, and 625 µg/mL, UV: 25, 125, and 250 µg/mL of enantiomeric concentration). Table 1 shows the linearity, reproducibility of retention time and peak area, and detection limit of the bromuconazole enantiomers (the concentrations indicate enantiomers). As shown in these results, widely linear dynamic range and highly sensitive detections were obtained, especially in the SIM chromatogram.
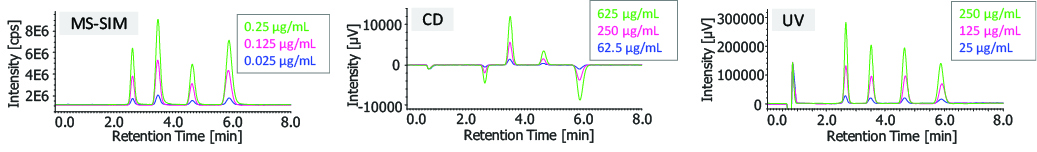
Table 1. Linearity, reproducibility of retention time and peak area, and detection limit of bromuconazole enantiomers
| %RSD (n=10) | ||||
| Correlation Coefficent | tR | Peak Area | Detection Limit (S/N=3) |
|
| MS-SIM (m/z 378.0) | 0.9994 - 0.9997 (0.0125 - 1.25 µg/mL) | 0.23 - 0.44*1 | 1.97 - 2.56*1 | 0.0010 - 0.0023 µg/mL*3 |
| CD | 0.9995 - 0.9998 (25 - 625 µg/mL) | 0.31 - 0.49*2 | 2.00 - 2.34*2 | 5.67 - 21.3 µg/mL*4 |
| UV | 0.9997 - 09999 (6.25 - 625 µg/mL) | 0.32 - 0.45*2 | 1.55 - 2.12*2 | 1.29 - 2.41 µg/mL*4 |
Conclusion
We developed the chiral separation method for pesticides by SFC with CD and MS detectors.
Detection by TIC, CD, and UV enable the clear identification of target chiral isomer groups and other contaminants using chiral separation.
Wide dynamic ranges and high sensitivity for each bromuconazole enantiomer were obtained, especially in the SIM chromatograms.
This system is applicable to many industries that deal with chiral compounds.
References
B. S. Sekhon, J. Pestic. Sci, 2009, 34 (1), 1-12.
V. Pérez-Fernández, M. Á. Garciá, M. L. Marina, J. Chromatogr. A, 2011, 1218, 6561-6582.
Featured Products:
-
SFC-FID for Petrochemical Analysis
SFC-FID
-
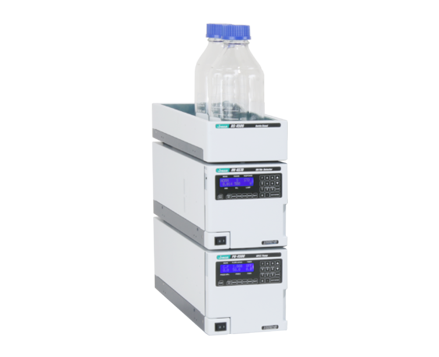
LC-4500 Series Compact HPLC
-
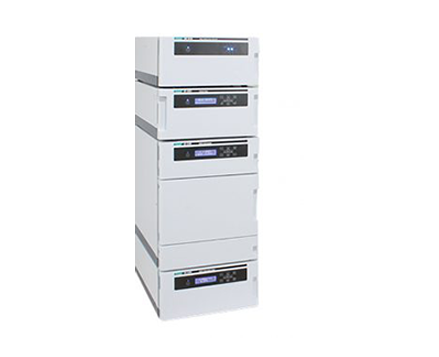
LC-4000 Series UHPLC

Highly Sensitive and Comprehensive Detection for Chiral Separation of Pesticide using SFC-CD-MS
Introduction
In this study, we developed a new method for the chiral separation of pesticides using SFC-CD-MS, with a circular dichroism detector (CD) and mass spectrometer (MS). Around 30% of pesticides currently used worldwide are chiral isomers with one or more chiral centers. It is well known that the enantiomers of chiral pesticides have different biological activities, toxicity on non-targeted organisms, rate of metabolism, and biodegradation in the environment. Although it is desirable to use the more effective and safer enantiomers, most chiral pesticides are marketed and used as racemates due to the complicated process and high cost of manufacturing a single enantiomer molecule.
In general, chiral separation by HPLC, GC, and SFC has been one of the most important ways for analyzing the synthetic approach to individual enantiomers. Although HPLC still dominates chromatographic chiral analysis because of its ease of use, SFC has advantages such as shorter analysis time and significant reduction in solvent consumption and cost.
A CD detector simultaneously provides circular dichroism and UV absorbance data, and enables selective identification of the CD polarity of each enantiomer. MS spectra are used to distinguish between chiral isomer groups with the same m/z from other components including impurities. Highly sensitive and comprehensive detection with UV, CD, and MS contributes to the widely applicable and highly accurate analysis for chiral separation in the efficient development of a single enantiomer pesticide. The system and chiral separation method described here is applicable to many industries that deal with chiral compounds. In this presentation, we will present the application of SFC to bromuconazole, a type of triazole fungicide (Figure 1).
Experimental
Apparatus
Figure 2 details the JASCO SFC-CD-MS system used in this experiment, together with Figure 3 that shows the schematic diagram of the system. Using a splitter with a PEEK-coated capillary tube, the flow from a chiral column is divided into two channels, one each to the CD and MS detectors. The CD detector provide the CD and UV signals simultaneously. This system enables automated method scouting analysis to be performed on mobile phases and columns.
Analysis Conditions for Method Scouting
Results
Results of Method Scouting on Mobile Phases and Columns
Racemic bromuconazole with 2 chiral centers can be separated into 4 isomer peaks using a chiral column. Figure 4 shows the selected results of method scouting analysis for mobile phases and columns. The best separation was observed with the combination of ethanol and CHIRALPAK AS-H (highlighted in yellow). This separation condition was used in the following experiments.
Comprehensive Detection by CD and MS Detectors
Figure 5 shows the results of a bromuconazole standard spiked with two additional pesticides, coumaphos and naproanilide, as contaminants detected by CD and MS detectors. Figure 5A shows the total ion chromatogram (TIC) from 100 to 600 m/z, extracted ion chromatogram (XIC) of m/z 378.0, CD and UV chromatograms. Figure 5B shows the MS spectra of each peak described in Figure 5A. As shown in this figure, we can clearly discriminate the bromuconazole isomers and other contaminants. Bromuconazole isomers (peaks 2, 4, 6, and 7) have similarities in their spectra, and a protonated molecular ion ([M+H]+) was observed at m/z 377.8 as a base peak in the mass spectrum of each isomer peak. Sodium formate adduct ions ([M+HCOONa]+) of coumaphos and naproanilide are also observed at m/z 430.9 (peak 1) and m/z 360.0 (peaks 3 and 5). Figure 6 shows the stopped-flow scanned spectra of CD and UV for bromuconazole standard peaks. In the spectral measurements, a 2-position 6-port switching valve is used in order to divert the flow and ‘park’ each peak in the flow cell for stopped flow measurement. The spectra of bromuconazole-1, 2, 3, and 4 correspond to peaks 2, 4, 6, and 7 in Figure 5A, respectively. According to the CD information in Figure 5A and Figure 6, peaks 2 and 6 of the bromuconazole isomers are estimated to be an enantiomeric pair from their CD polarity and maximum wavelength. Peak 4 and 7 are also the same.
In this way, comprehensive detection by CD and MS detectors is useful to identify the target chiral isomers group and other contaminants with chiral separation.
Linearity, Reproducibility and Sensitivity
Figure 7 shows the overlaid chromatograms of SIM (Single Ion Monitoring) at m/z 378.0, CD, and UV of bromuconazole standards (SIM: 0.025, 0.125, and 0.25 µg/mL, CD: 62.5, 250, and 625 µg/mL, UV: 25, 125, and 250 µg/mL of enantiomeric concentration). Table 1 shows the linearity, reproducibility of retention time and peak area, and detection limit of the bromuconazole enantiomers (the concentrations indicate enantiomers). As shown in these results, widely linear dynamic range and highly sensitive detections were obtained, especially in the SIM chromatogram.
Table 1. Linearity, reproducibility of retention time and peak area, and detection limit of bromuconazole enantiomers
| %RSD (n=10) | ||||
| Correlation Coefficent | tR | Peak Area | Detection Limit (S/N=3) |
|
| MS-SIM (m/z 378.0) | 0.9994 - 0.9997 (0.0125 - 1.25 µg/mL) | 0.23 - 0.44*1 | 1.97 - 2.56*1 | 0.0010 - 0.0023 µg/mL*3 |
| CD | 0.9995 - 0.9998 (25 - 625 µg/mL) | 0.31 - 0.49*2 | 2.00 - 2.34*2 | 5.67 - 21.3 µg/mL*4 |
| UV | 0.9997 - 09999 (6.25 - 625 µg/mL) | 0.32 - 0.45*2 | 1.55 - 2.12*2 | 1.29 - 2.41 µg/mL*4 |
Conclusion
We developed the chiral separation method for pesticides by SFC with CD and MS detectors.
Detection by TIC, CD, and UV enable the clear identification of target chiral isomer groups and other contaminants using chiral separation.
Wide dynamic ranges and high sensitivity for each bromuconazole enantiomer were obtained, especially in the SIM chromatograms.
This system is applicable to many industries that deal with chiral compounds.
Keywords
101022U
References
B. S. Sekhon, J. Pestic. Sci, 2009, 34 (1), 1-12.
V. Pérez-Fernández, M. Á. Garciá, M. L. Marina, J. Chromatogr. A, 2011, 1218, 6561-6582.