Color Analysis using a UV-Visible Spectrophotometer
January 4, 2024
 Download This Application
Introduction
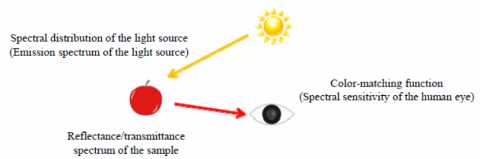
Color is a visually perceived property that is derived from the reflected or transmitted spectrum of light interacting with the human eye. It is important for the development and production of color-based products to evaluate and obtain measurable factors that describe the color. JASCO has developed a variety of color analysis using a UV-Visible spectrophotometer for both reflectance and/or transmittance spectra of samples. The V-700 spectrophotometers have a double-beam optical system that provides high measurement accuracy and stability, which results in color evaluation that can be determined with high reproducibility.
This application note tests the reproducibility of color evaluation made using JASCO’s color diagnosis system.
Experimental
Measurements were obtained for blue, red, and yellow pellets. Baseline measurement was performed using a standard white reference plate and then the sample was measured. Both reference and sample measurements were made with the specular component included. To confirm the measurement reproducibility 10 spectra were collected with the sample removed and replaced in between scans to assess the effects of changing the measurement position.
Keywords
040-UV-0044B, V-700, UV-Visible/NIR, Chromaticity, Color Analysis, Material, ISV-922 Integrating Sphere, Color Diagnosis program
Results
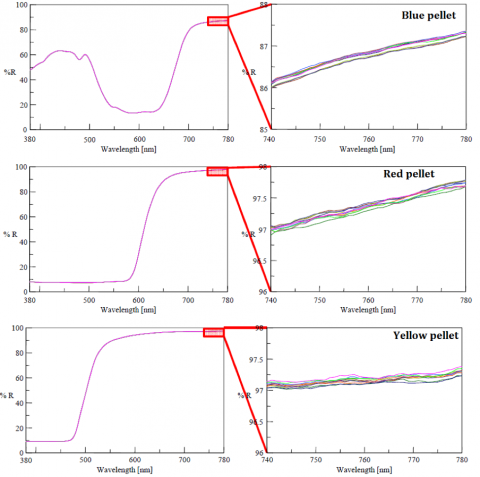
The reflectance spectra for each sample are shown in Figure 2. The figure on the right shows zoomed-in spectra in the wavelength range 740 – 780 nm. As shown in each spectrum, the difference between maxima and minima of the photometric value is less than 0.15%R, indicating high reproducibility measurements.
The Color Diagnosis Program was used to calculate color coordinates from the measured reflectance spectra. Figure 3 shows the results plotted on XYZ, L*a*b*, Lab, and L*u*v* chromaticity diagrams. The calculated values are shown in Tables 1, 2 and 3 for the blue, red, and yellow pellets, respectively. For the color coordinates that represent chroma and hue (xy, a*b*, ab, u*v*), the difference between maxima and the minima are; x and y, less than 0.0012, a* and b*, less than 0.31, a and b, less than 0.18, u* and v*, less than 0.50. For the color coordinates that represent brightness (Y, L, L*), the difference between the maxima and minima is less than 0.1. All results indicate highly reproducible chromaticity values using the Color Diagnosis system.
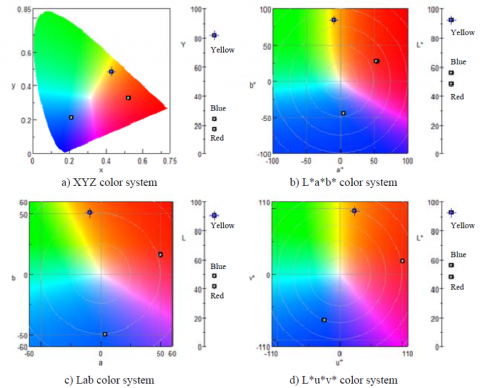
Table 1. Color calculation results of blue color pellet.
| X | Y | Z | x | y | L* | a* | b* | L | a | b | u* | v* | |
| 1 | 23.77 | 23.94 | 65.84 | 0.2094 | 0.2108 | 56.03 | 4.58 | -44.94 | 48.93 | 3.78 | -50.19 | -24.75 | -70.73 |
| 2 | 23.77 | 23.94 | 65.81 | 0.2094 | 0.2109 | 56.03 | 4.57 | -44.91 | 48.93 | 3.78 | -50.15 | -24.74 | -70.69 |
| 3 | 23.74 | 23.91 | 65.70 | 0.2095 | 0.2109 | 55.99 | 4.57 | -44.88 | 48.89 | 3.78 | -50.09 | -24.71 | -70.62 |
| 4 | 23.76 | 23.93 | 65.72 | 0.2095 | 0.2110 | 56.01 | 4.57 | -44.87 | 48.91 | 3.78 | -50.08 | -24.71 | -70.60 |
| 5 | 23.76 | 23.92 | 65.71 | 0.2095 | 0.2110 | 56.01 | 4.56 | -44.85 | 48.91 | 3.77 | -50.06 | -24.71 | -70.58 |
| 6 | 23.79 | 23.96 | 65.85 | 0.2094 | 0.2109 | 56.04 | 4.57 | -44.92 | 48.95 | 3.78 | -50.16 | -24.75 | -70.70 |
| 7 | 23.80 | 23.97 | 65.85 | 0.2095 | 0.2110 | 56.06 | 4.55 | -44.89 | 48.96 | 3.77 | -50.12 | -24.74 | -70.65 |
| 8 | 23.81 | 23.98 | 65.83 | 0.2095 | 0.2111 | 56.07 | 4.55 | -44.87 | 48.97 | 3.76 | -50.08 | -24.73 | -70.62 |
| 9 | 23.80 | 23.97 | 65.79 | 0.2096 | 0.2111 | 56.06 | 4.55 | -44.85 | 48.96 | 3.76 | -50.06 | -24.71 | -70.58 |
| 10 | 23.80 | 23.97 | 65.81 | 0.2095 | 0.2111 | 56.06 | 4.55 | -44.86 | 48.96 | 3.76 | -50.08 | -24.73 | -70.61 |
| Max-Min | 0.07 | 0.07 | 0.15 | 0.0002 | 0.0003 | 0.07 | 0.03 | 0.09 | 0.07 | 0.02 | 0.13 | 0.05 | 0.14 |
| Ave | 23.78 | 23.95 | 65.79 | 0.21 | 0.21 | 56.04 | 4.56 | -44.88 | 48.94 | 3.77 | -50.11 | -24.73 | -70.64 |
| SD | 0.02289 | 0.02509 | 0.05879 | 0.00006 | 0.00008 | 0.0252 | 0.0104 | 0.0312 | 0.0256 | 0.0083 | 0.0456 | 0.0168 | 0.0512 |
| CV% | 0.10 | 0.10 | 0.09 | 0.03 | 0.04 | 0.4 | 0.23 | -0.07 | 0.05 | 0.22 | -0.09 | -0.07 | -0.07 |
Table 2. Color calculation results of red color pellet.
| X | Y | Z | x | y | L* | a* | b* | L | a | b | u* | v* | |
| 1 | 27.74 | 17.16 | 8.17 | 0.5226 | 0.3234 | 48.47 | 53.78 | 26.78 | 41.43 | 49.99 | 15.67 | 101.05 | 19.17 |
| 2 | 27.78 | 17.17 | 8.09 | 0.5238 | 0.3237 | 48.47 | 53.94 | 27.08 | 41.44 | 50.17 | 15.80 | 101.55 | 19.40 |
| 3 | 27.76 | 17.15 | 8.10 | 0.5236 | 0.3236 | 48.45 | 53.92 | 27.02 | 41.41 | 50.14 | 15.77 | 101.46 | 19.34 |
| 4 | 27.75 | 17.15 | 8.08 | 0.5238 | 0.3237 | 48.45 | 53.92 | 27.06 | 41.41 | 50.13 | 15.79 | 101.48 | 19.37 |
| 5 | 27.73 | 17.14 | 8.10 | 0.5236 | 0.3236 | 48.43 | 53.90 | 26.99 | 41.40 | 50.11 | 15.75 | 101.39 | 19.31 |
| 6 | 27.70 | 17.11 | 8.10 | 0.5235 | 0.3235 | 48.40 | 53.89 | 26.94 | 41.37 | 50.10 | 15.73 | 101.35 | 19.27 |
| 7 | 27.76 | 17.18 | 8.13 | 0.5231 | 0.3237 | 48.49 | 53.80 | 26.97 | 41.45 | 50.01 | 15.76 | 101.21 | 19.34 |
| 8 | 27.72 | 17.14 | 8.11 | 0.5233 | 0.3235 | 48.43 | 53.85 | 26.93 | 41.40 | 50.06 | 15.73 | 101.27 | 19.27 |
| 9 | 27.72 | 17.14 | 8.11 | 0.5233 | 0.3235 | 48.43 | 53.86 | 26.93 | 41.40 | 50.06 | 15.73 | 101.28 | 19.27 |
| 10 | 27.77 | 17.19 | 8.13 | 0.5231 | 0.3238 | 48.50 | 53.78 | 26.97 | 41.46 | 50.00 | 15.76 | 101.18 | 19.35 |
| Max-Min | 0.09 | 0.08 | 0.08 | 0.0012 | 0.0004 | 0.10 | 0.16 | 0.31 | 0.09 | 0.18 | 0.13 | 0.50 | 0.23 |
| Ave | 27.74 | 17.15 | 8.11 | 0.52 | 0.32 | 48.45 | 53.86 | 26.97 | 41.42 | 50.08 | 15.75 | 101.32 | 19.31 |
| SD | 0.0270 | 0.0230 | 0.0274 | 0.00038 | 0.00012 | 0.0288 | 0.0613 | 0.0852 | 0.0278 | 0.0640 | 0.0377 | 0.1545 | 0.0670 |
| CV % | 0.10 | 0.13 | 0.34 | 0.07 | 0.04 | 0.06 | 0.11 | 0.32 | 0.07 | 0.13 | 0.24 | 0.15 | 0.35 |
Table 3. Color calculation results of yellow color pellet.
| X | Y | Z | x | y | L* | a* | b* | L | a | b | u* | v* | |
| 1 | 27.74 | 17.16 | 8.17 | 0.5236 | 0.3234 | 48.47 | 53.78 | 26.78 | 41.43 | 49.99 | 15.67 | 101.05 | 19.17 |
| 2 | 27.78 | 17.17 | 8.09 | 0.5238 | 0.3237 | 48.47 | 53.94 | 27.08 | 41.44 | 50.17 | 15.80 | 101.55 | 19.40 |
| 3 | 27.76 | 17.15 | 8.10 | 0.5236 | 0.3236 | 48.45 | 53.92 | 27.02 | 41.41 | 50.14 | 15.77 | 101.46 | 19.34 |
| 4 | 27.75 | 17.15 | 8.08 | 0.5238 | 0.3237 | 48.45 | 53.92 | 27.06 | 41.41 | 50.13 | 15.79 | 101.48 | 19.37 |
| 5 | 27.73 | 17.14 | 8.10 | 0.5236 | 0.3236 | 48.43 | 53.90 | 26.99 | 41.40 | 50.11 | 15.75 | 101.39 | 19.31 |
| 6 | 27.70 | 17.11 | 8.10 | 0.5235 | 0.3235 | 48.40 | 53.89 | 26.94 | 41.37 | 50.10 | 15.73 | 101.35 | 19.27 |
| 7 | 27.76 | 17.18 | 8.13 | 0.5231 | 0.3237 | 48.49 | 53.80 | 26.97 | 41.45 | 50.01 | 15.76 | 101.21 | 19.34 |
| 8 | 27.72 | 17.14 | 8.11 | 0.5233 | 0.3235 | 48.43 | 53.85 | 26.93 | 41.40 | 50.06 | 15.73 | 101.27 | 19.27 |
| 9 | 27.72 | 17.14 | 8.11 | 0.5233 | 0.3235 | 48.43 | 53.86 | 26.93 | 41.40 | 50.06 | 15.73 | 101.28 | 19.27 |
| 10 | 27.77 | 17.19 | 8.13 | 0.5231 | 0.3238 | 48.50 | 53.78 | 26.97 | 41.46 | 50.00 | 15.76 | 101.18 | 19.35 |
| Max-Min | 0.09 | 0.08 | 0.08 | 0.0012 | 0.0004 | 0.10 | 0.16 | 0.31 | 0.09 | 0.18 | 0.13 | 0.50 | 0.23 |
| Ave. | 27.74 | 17.15 | 8.11 | 0.52 | 0.32 | 48.45 | 53.86 | 26.97 | 41.42 | 50.08 | 15.75 | 101.32 | 19.31 |
| SD | 0.0270 | 0.0230 | 0.0274 | 0.00038 | 0.00012 | 0.0288 | 0.0613 | 0.0852 | 0.0278 | 0.0640 | 0.0377 | 0.1545 | 0.0670 |
| CV% | 0.10 | 0.13 | 0.34 | 0.07 | 0.04 | 0.06 | 0.11 | 0.32 | 0.07 | 0.13 | 0.24 | 0.15 | 0.35 |
Analysis Conditions: Light Source, D65 (CIE 15:2004, JIS Z 8781-1:2012, ISO 11664-2:2007); Color-matching function, CIE 15:2004, JIS Z 8701:1982; Viewing angle, 2º; Data interval, 5 nm.
Featured Products:
-
A general-purpose double-beam spectrophotometer with a compact space saving design
V-730 UV-Visible Spectrophotometer
-
A high resolution UV-Visible double-beam spectrophotometer with single monochromator, variable SBW and PMT detector
V-750 UV-Visible Spectrophotometer

Color Analysis using a UV-Visible Spectrophotometer
Introduction
Color is a visually perceived property that is derived from the reflected or transmitted spectrum of light interacting with the human eye. It is important for the development and production of color-based products to evaluate and obtain measurable factors that describe the color. JASCO has developed a variety of color analysis using a UV-Visible spectrophotometer for both reflectance and/or transmittance spectra of samples. The V-700 spectrophotometers have a double-beam optical system that provides high measurement accuracy and stability, which results in color evaluation that can be determined with high reproducibility.
This application note tests the reproducibility of color evaluation made using JASCO’s color diagnosis system.
Experimental
Measurements were obtained for blue, red, and yellow pellets. Baseline measurement was performed using a standard white reference plate and then the sample was measured. Both reference and sample measurements were made with the specular component included. To confirm the measurement reproducibility 10 spectra were collected with the sample removed and replaced in between scans to assess the effects of changing the measurement position.
Results
The reflectance spectra for each sample are shown in Figure 2. The figure on the right shows zoomed-in spectra in the wavelength range 740 – 780 nm. As shown in each spectrum, the difference between maxima and minima of the photometric value is less than 0.15%R, indicating high reproducibility measurements.
The Color Diagnosis Program was used to calculate color coordinates from the measured reflectance spectra. Figure 3 shows the results plotted on XYZ, L*a*b*, Lab, and L*u*v* chromaticity diagrams. The calculated values are shown in Tables 1, 2 and 3 for the blue, red, and yellow pellets, respectively. For the color coordinates that represent chroma and hue (xy, a*b*, ab, u*v*), the difference between maxima and the minima are; x and y, less than 0.0012, a* and b*, less than 0.31, a and b, less than 0.18, u* and v*, less than 0.50. For the color coordinates that represent brightness (Y, L, L*), the difference between the maxima and minima is less than 0.1. All results indicate highly reproducible chromaticity values using the Color Diagnosis system.
Table 1. Color calculation results of blue color pellet.
| X | Y | Z | x | y | L* | a* | b* | L | a | b | u* | v* | |
| 1 | 23.77 | 23.94 | 65.84 | 0.2094 | 0.2108 | 56.03 | 4.58 | -44.94 | 48.93 | 3.78 | -50.19 | -24.75 | -70.73 |
| 2 | 23.77 | 23.94 | 65.81 | 0.2094 | 0.2109 | 56.03 | 4.57 | -44.91 | 48.93 | 3.78 | -50.15 | -24.74 | -70.69 |
| 3 | 23.74 | 23.91 | 65.70 | 0.2095 | 0.2109 | 55.99 | 4.57 | -44.88 | 48.89 | 3.78 | -50.09 | -24.71 | -70.62 |
| 4 | 23.76 | 23.93 | 65.72 | 0.2095 | 0.2110 | 56.01 | 4.57 | -44.87 | 48.91 | 3.78 | -50.08 | -24.71 | -70.60 |
| 5 | 23.76 | 23.92 | 65.71 | 0.2095 | 0.2110 | 56.01 | 4.56 | -44.85 | 48.91 | 3.77 | -50.06 | -24.71 | -70.58 |
| 6 | 23.79 | 23.96 | 65.85 | 0.2094 | 0.2109 | 56.04 | 4.57 | -44.92 | 48.95 | 3.78 | -50.16 | -24.75 | -70.70 |
| 7 | 23.80 | 23.97 | 65.85 | 0.2095 | 0.2110 | 56.06 | 4.55 | -44.89 | 48.96 | 3.77 | -50.12 | -24.74 | -70.65 |
| 8 | 23.81 | 23.98 | 65.83 | 0.2095 | 0.2111 | 56.07 | 4.55 | -44.87 | 48.97 | 3.76 | -50.08 | -24.73 | -70.62 |
| 9 | 23.80 | 23.97 | 65.79 | 0.2096 | 0.2111 | 56.06 | 4.55 | -44.85 | 48.96 | 3.76 | -50.06 | -24.71 | -70.58 |
| 10 | 23.80 | 23.97 | 65.81 | 0.2095 | 0.2111 | 56.06 | 4.55 | -44.86 | 48.96 | 3.76 | -50.08 | -24.73 | -70.61 |
| Max-Min | 0.07 | 0.07 | 0.15 | 0.0002 | 0.0003 | 0.07 | 0.03 | 0.09 | 0.07 | 0.02 | 0.13 | 0.05 | 0.14 |
| Ave | 23.78 | 23.95 | 65.79 | 0.21 | 0.21 | 56.04 | 4.56 | -44.88 | 48.94 | 3.77 | -50.11 | -24.73 | -70.64 |
| SD | 0.02289 | 0.02509 | 0.05879 | 0.00006 | 0.00008 | 0.0252 | 0.0104 | 0.0312 | 0.0256 | 0.0083 | 0.0456 | 0.0168 | 0.0512 |
| CV% | 0.10 | 0.10 | 0.09 | 0.03 | 0.04 | 0.4 | 0.23 | -0.07 | 0.05 | 0.22 | -0.09 | -0.07 | -0.07 |
Table 2. Color calculation results of red color pellet.
| X | Y | Z | x | y | L* | a* | b* | L | a | b | u* | v* | |
| 1 | 27.74 | 17.16 | 8.17 | 0.5226 | 0.3234 | 48.47 | 53.78 | 26.78 | 41.43 | 49.99 | 15.67 | 101.05 | 19.17 |
| 2 | 27.78 | 17.17 | 8.09 | 0.5238 | 0.3237 | 48.47 | 53.94 | 27.08 | 41.44 | 50.17 | 15.80 | 101.55 | 19.40 |
| 3 | 27.76 | 17.15 | 8.10 | 0.5236 | 0.3236 | 48.45 | 53.92 | 27.02 | 41.41 | 50.14 | 15.77 | 101.46 | 19.34 |
| 4 | 27.75 | 17.15 | 8.08 | 0.5238 | 0.3237 | 48.45 | 53.92 | 27.06 | 41.41 | 50.13 | 15.79 | 101.48 | 19.37 |
| 5 | 27.73 | 17.14 | 8.10 | 0.5236 | 0.3236 | 48.43 | 53.90 | 26.99 | 41.40 | 50.11 | 15.75 | 101.39 | 19.31 |
| 6 | 27.70 | 17.11 | 8.10 | 0.5235 | 0.3235 | 48.40 | 53.89 | 26.94 | 41.37 | 50.10 | 15.73 | 101.35 | 19.27 |
| 7 | 27.76 | 17.18 | 8.13 | 0.5231 | 0.3237 | 48.49 | 53.80 | 26.97 | 41.45 | 50.01 | 15.76 | 101.21 | 19.34 |
| 8 | 27.72 | 17.14 | 8.11 | 0.5233 | 0.3235 | 48.43 | 53.85 | 26.93 | 41.40 | 50.06 | 15.73 | 101.27 | 19.27 |
| 9 | 27.72 | 17.14 | 8.11 | 0.5233 | 0.3235 | 48.43 | 53.86 | 26.93 | 41.40 | 50.06 | 15.73 | 101.28 | 19.27 |
| 10 | 27.77 | 17.19 | 8.13 | 0.5231 | 0.3238 | 48.50 | 53.78 | 26.97 | 41.46 | 50.00 | 15.76 | 101.18 | 19.35 |
| Max-Min | 0.09 | 0.08 | 0.08 | 0.0012 | 0.0004 | 0.10 | 0.16 | 0.31 | 0.09 | 0.18 | 0.13 | 0.50 | 0.23 |
| Ave | 27.74 | 17.15 | 8.11 | 0.52 | 0.32 | 48.45 | 53.86 | 26.97 | 41.42 | 50.08 | 15.75 | 101.32 | 19.31 |
| SD | 0.0270 | 0.0230 | 0.0274 | 0.00038 | 0.00012 | 0.0288 | 0.0613 | 0.0852 | 0.0278 | 0.0640 | 0.0377 | 0.1545 | 0.0670 |
| CV % | 0.10 | 0.13 | 0.34 | 0.07 | 0.04 | 0.06 | 0.11 | 0.32 | 0.07 | 0.13 | 0.24 | 0.15 | 0.35 |
Table 3. Color calculation results of yellow color pellet.
| X | Y | Z | x | y | L* | a* | b* | L | a | b | u* | v* | |
| 1 | 27.74 | 17.16 | 8.17 | 0.5236 | 0.3234 | 48.47 | 53.78 | 26.78 | 41.43 | 49.99 | 15.67 | 101.05 | 19.17 |
| 2 | 27.78 | 17.17 | 8.09 | 0.5238 | 0.3237 | 48.47 | 53.94 | 27.08 | 41.44 | 50.17 | 15.80 | 101.55 | 19.40 |
| 3 | 27.76 | 17.15 | 8.10 | 0.5236 | 0.3236 | 48.45 | 53.92 | 27.02 | 41.41 | 50.14 | 15.77 | 101.46 | 19.34 |
| 4 | 27.75 | 17.15 | 8.08 | 0.5238 | 0.3237 | 48.45 | 53.92 | 27.06 | 41.41 | 50.13 | 15.79 | 101.48 | 19.37 |
| 5 | 27.73 | 17.14 | 8.10 | 0.5236 | 0.3236 | 48.43 | 53.90 | 26.99 | 41.40 | 50.11 | 15.75 | 101.39 | 19.31 |
| 6 | 27.70 | 17.11 | 8.10 | 0.5235 | 0.3235 | 48.40 | 53.89 | 26.94 | 41.37 | 50.10 | 15.73 | 101.35 | 19.27 |
| 7 | 27.76 | 17.18 | 8.13 | 0.5231 | 0.3237 | 48.49 | 53.80 | 26.97 | 41.45 | 50.01 | 15.76 | 101.21 | 19.34 |
| 8 | 27.72 | 17.14 | 8.11 | 0.5233 | 0.3235 | 48.43 | 53.85 | 26.93 | 41.40 | 50.06 | 15.73 | 101.27 | 19.27 |
| 9 | 27.72 | 17.14 | 8.11 | 0.5233 | 0.3235 | 48.43 | 53.86 | 26.93 | 41.40 | 50.06 | 15.73 | 101.28 | 19.27 |
| 10 | 27.77 | 17.19 | 8.13 | 0.5231 | 0.3238 | 48.50 | 53.78 | 26.97 | 41.46 | 50.00 | 15.76 | 101.18 | 19.35 |
| Max-Min | 0.09 | 0.08 | 0.08 | 0.0012 | 0.0004 | 0.10 | 0.16 | 0.31 | 0.09 | 0.18 | 0.13 | 0.50 | 0.23 |
| Ave. | 27.74 | 17.15 | 8.11 | 0.52 | 0.32 | 48.45 | 53.86 | 26.97 | 41.42 | 50.08 | 15.75 | 101.32 | 19.31 |
| SD | 0.0270 | 0.0230 | 0.0274 | 0.00038 | 0.00012 | 0.0288 | 0.0613 | 0.0852 | 0.0278 | 0.0640 | 0.0377 | 0.1545 | 0.0670 |
| CV% | 0.10 | 0.13 | 0.34 | 0.07 | 0.04 | 0.06 | 0.11 | 0.32 | 0.07 | 0.13 | 0.24 | 0.15 | 0.35 |
Analysis Conditions: Light Source, D65 (CIE 15:2004, JIS Z 8781-1:2012, ISO 11664-2:2007); Color-matching function, CIE 15:2004, JIS Z 8701:1982; Viewing angle, 2º; Data interval, 5 nm.
Keywords
040-UV-0044B, V-700, UV-Visible/NIR, Chromaticity, Color Analysis, Material, ISV-922 Integrating Sphere, Color Diagnosis program