Evaluation of HOS identity and VHH antibody binding to coronavirus using Circular Dichroism Spectroscopy
January 5, 2024
 Download This Application
Introduction
The path of a biopharmaceutical from research and development to consumer availability is a long and thorough process, intended to ensure efficacious and quality control. Development of biosimilars requires evaluation of the molecule’s higher order structure (HOS) with the original biopharmaceutical. Additionally, the structure of biopharmaceuticals is sensitive to changes in the manufacturing process or storage environment and it is necessary to evaluate the higher order structure of these molecules sustained after any processing or storage alterations.
CD spectroscopy is widely used to assess HOS in biopharmaceuticals because the far-UV CD is sensitive to changes in the bond angles of a protein’s backbone chain and secondary structure and the near-UV monitors the tertiary structure, composed of aromatic amino acids residues and disulfide bonds. Here, we evaluate the HOS of three types of new anti-coronavirus (SARS-CoV-2) VHH antibodies using the [Spectral QC test] program that quantitatively determines the significance in structure changes based on the difference in CD spectral shape.
Experimental
| Far-UV Measurement Conditions | |||
| Wavelength | 250 - 200 nm | Bandwidth | 1 nm |
| D.I.T. | 4 sec | Scanning Speed | 50 nm/min |
| Data Interval | 0.1 nm | Accumulations | 1 |
| Near-UV Measurement Conditions | |||
| Wavelength | 310 - 250 nm | Bandwidth | 1 nm |
| D.I.T. | 4 sec | Scanning Speed | 20 nm/min |
| Data Interval | 0.1 nm | Accumulations | 4 |
Determination of differences in CD spectra
Far-UV CD measurements were acquired for 3 kinds of anti-SARS-CoV-2 VHH antibodies in 20 mM PBS buffer using the following concentrations: No.1 (0.2 mg/mL), No.2 (0.2 mg/mL), No.3 (0.2 mg/mL). Near-UV CD measurements were obtained on the same samples using the following concentrations: No.1 (6.27 mg/mL), No.2 (7.22 mg/mL), No.3 (5.15 mg/mL). All VHH antibody samples were provided by RePHAGEN3.
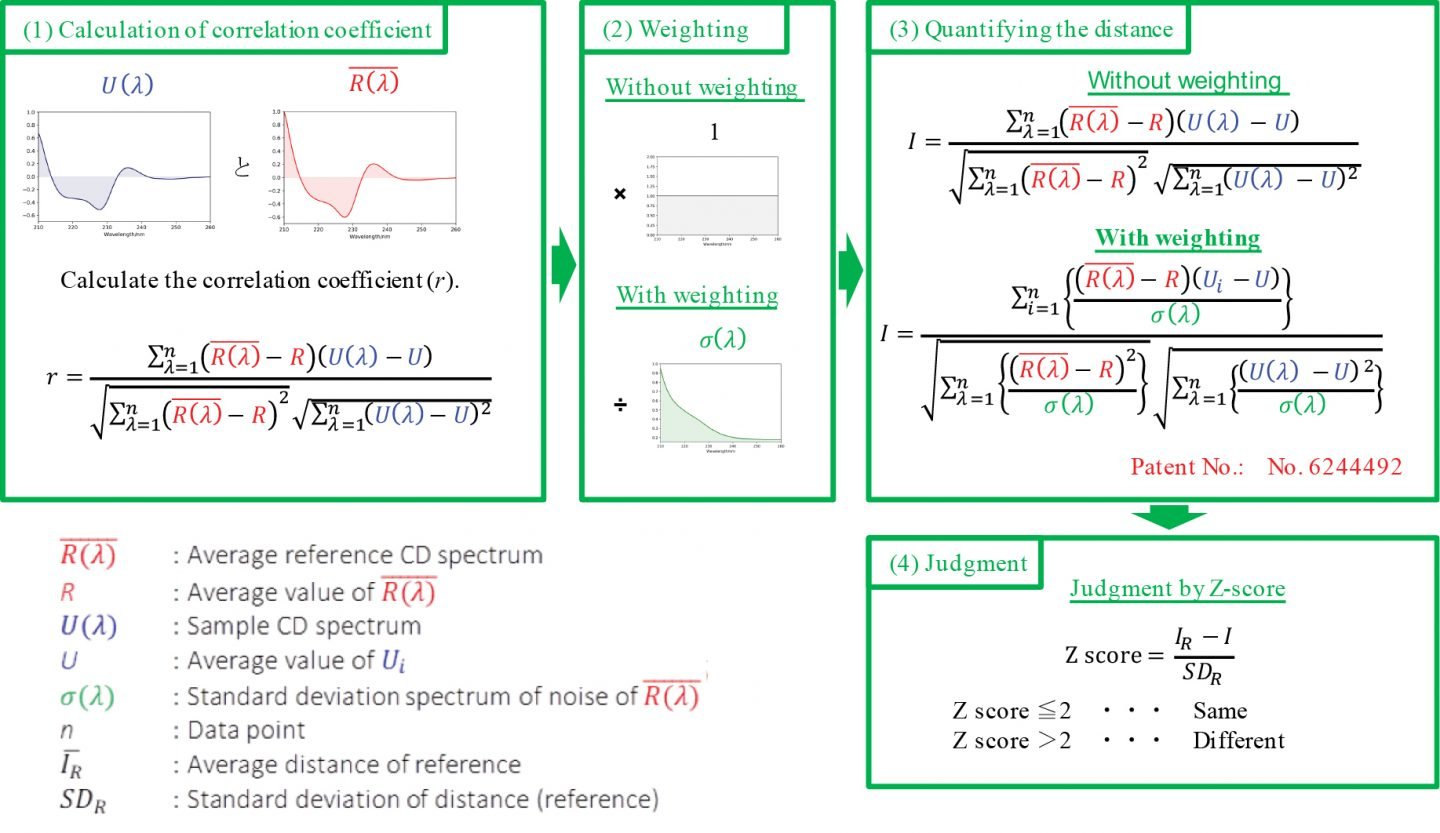
Figure 1 shows the method analysis steps for determining the CD spectrum difference between the reference and the sample in the [Spectrum QC Test] program, as explained below.
(1) Calculation of correlation coefficient: The CD spectrum of the reference sample is measured multiple times, and the correlation coefficient between the average spectrum R (λ) and the CD spectrum U (λ) of the sample is calculated.
(2) Weighting: The [Spectral QC Test] program allows the user to choose whether to weight the spectrum. The CD spectrum has a low S/N due to weak light energy detected in the shorter wavelength region as well as the wavelength region where sample absorption is strong. Therefore, it is possible to reduce the weighting of the spectrum in the wavelength range where the effects from noise are large and increase the weighting in the wavelength range where noise is small (Patent No. 6244492). As a result of this data processing, the influence of noise can be reduced in the wavelength range where the S/N is smaller, and the spectral difference between samples can be determined with high sensitivity.
(3) Quantify the difference (i.e. distance (I)) between the reference and sample CD spectra.
(4) Judgment: The Z-test determines if there is a significant difference between the reference and sample spectra. If the Z-score is 2 or less, the reference and the sample are judged to be the same, and if the Z-score is larger than 2, the reference and the sample are judged to be different.
Keywords
200-CD-0036B, New corona virus, SARS-CoV-2, COVID-19, Biopharmaceuticals, Antibody drug, BioSimilar, VHH antibody, HOS, Secondary Structure, Tertiary Structure, Circular Dichroism
Results
Visual comparison of CD spectra
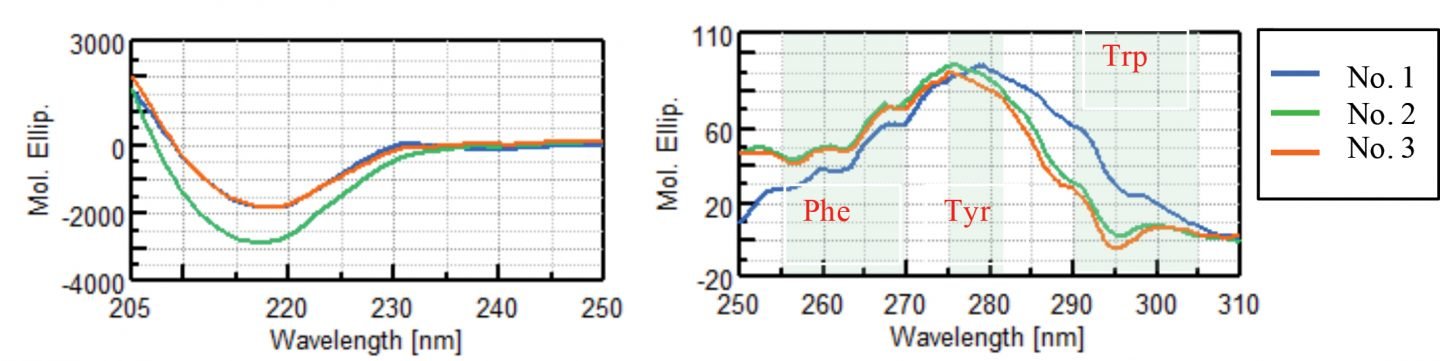
Figure 2 shows the CD spectra of VHH antibodies in the far-UV region and near-UV region. In the far-UV region, a negative signal at 217 nm characteristic of β-sheet structure was observed only for sample No. 2 and no significant difference was observed in the CD spectra for samples No. 1 and No. 3. In the near-UV CD spectra, signals derived from phenylalanine (Phe) at 255 to 270 nm, tyrosine (Tyr) at 275 to 282 nm, and tryptophan (Trp) at 290 to 305 nm were observed in all samples. While the CD spectra of samples No. 2 and No. 3 are visually similar, the spectra of sample No. 1 is clearly different.
Judgment of slight CD spectrum difference by statistical method
The differences in the far-UV CD spectra of samples No. 1 and No. 3 and the near-UV CD spectra of samples No. 2 and No. 3 cannot be clearly discriminated. However, using the [Spectrum QC Test] program, the distance between the spectra was obtained by the analysis method shown in Figure 1, and the differences judged by the Z-test. The number of spectral data used for the analysis is as follows and the individual spectra are shown in Figure 3:
Far-UV region: Reference No. 1 (9 spectra), sample No. 3 (5 spectra)
Near-UV region: Reference No. 2 (9 spectra), sample No. 3 (5 spectra)
![Far- UV (left) and near-UV) right CD spectra of the VHH antibodies analyzed using the [Spectrum QC Test] program.](https://jascoinc.com/wp-content/uploads/2020/06/CD-036-fig3-1440x446.jpg)
The distance between the reference and sample CD spectra is shown in Figure 4 and the corresponding values are shown in Table 1. From Figure 4 it can be seen that weighting both the far-UV and the near-UV spectra increases the distance between reference and sample and the difference between them can be clearly confirmed.
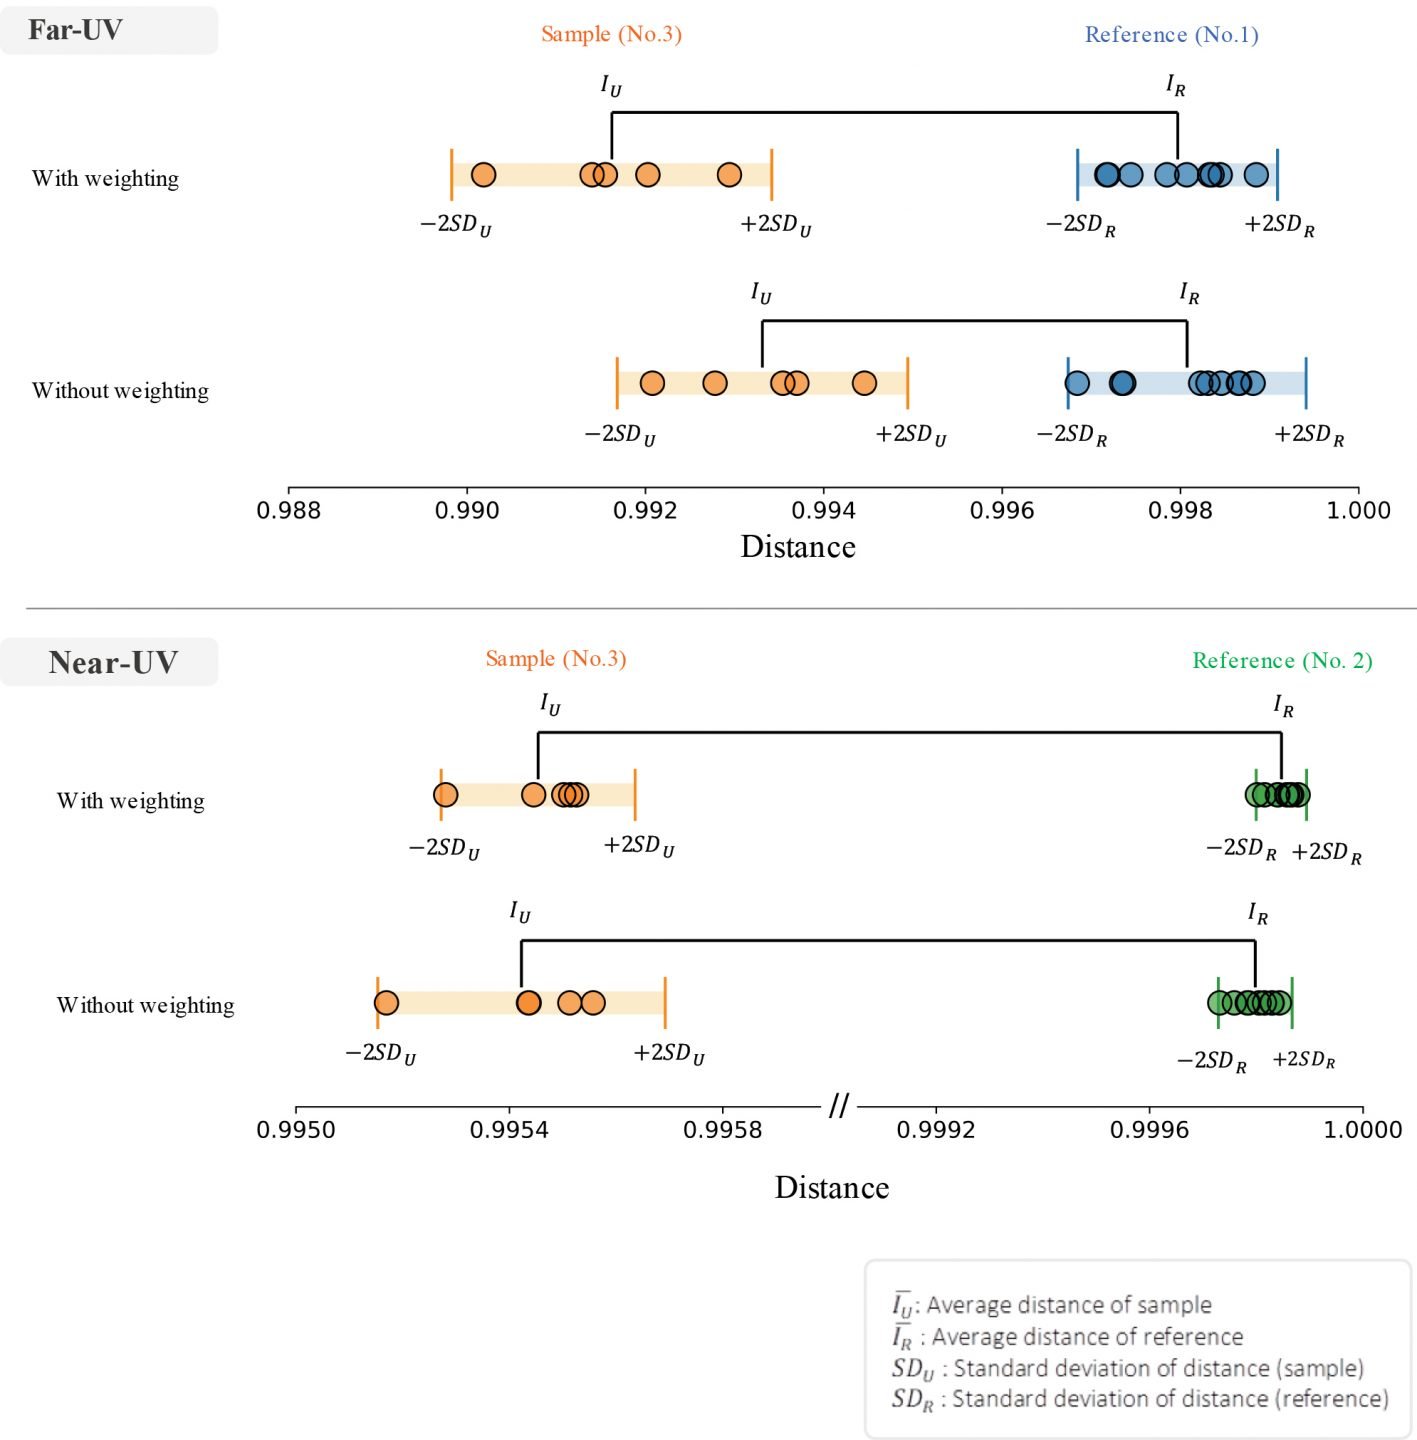
Table 1. Distances between the reference and sample far-UV (left) and near-UV (right) CD spectra.
| Far-UV | Reference (No. 1) | Sample (No. 3) | ||
| No. of Measurement | Weighted | No Weighting | Weighted | No Weighting |
| 1 | 0.9984 | 0.9987 | 0.9916 | 0.9935 |
| 2 | 0.9983 | 0.9985 | 0.9902 | 0.9921 |
| 3 | 0.9978 | 0.9983 | 0.9929 | 0.9945 |
| 4 | 0.9972 | 0.9968 | 0.9914 | 0.9928 |
| 5 | 0.9989 | 0.9988 | 0.9920 | 0.9937 |
| 6 | 0.9984 | 0.9987 | ||
| 7 | 0.9974 | 0.9973 | ||
| 8 | 0.9972 | 0.9974 | ||
| 9 | 0.9981 | 0.9982 | ||
| Near-UV | Reference (No. 1) | Sample (No. 3) | ||
| No. of Measurement | Weighted | No Weighting | Weighted | No Weighting |
| 1 | 0.99980 | 0.99973 | 0.9955 | 0.9956 |
| 2 | 0.99988 | 0.99984 | 0.9955 | 0.9954 |
| 3 | 0.99986 | 0.99982 | 0.9955 | 0.9954 |
| 4 | 0.99986 | 0.99983 | 0.9954 | 0.9955 |
| 5 | 0.99987 | 0.99983 | 0.9953 | 0.9952 |
| 6 | 0.99984 | 0.99978 | ||
| 7 | 0.99986 | 0.99981 | ||
| 8 | 0.99984 | 0.99979 | ||
| 9 | 0.99982 | 0.99976 | ||
In addition, the Z-scores are shown in Table 2. The Z-scores were all larger than 2 with and without weighting, indicating that there was a significant difference between the CD spectrum of the reference and sample both in the far- and near-UV.
Table 2. Calculated Z-scores from far-UV and near-UV CD spectra using [Spectrum QC Test] program.
[table “455” not found /]| No. of Measurement | Far-UV | Far-UV | ||
| Weighted | No Weighting | Weighted | No Weighting | |
| 1 | 11.5 | 6.8 | 184 | 123 |
| 2 | 13.9 | 9.0 | 183 | 126 |
| 3 | 9.0 | 5.4 | 184 | 126 |
| 4 | 11.7 | 7.9 | 187 | 124 |
| 5 | 10.6 | 6.6 | 194 | 134 |
References
1) W. F. W. 4th, J. P. Gabrielson, W. Al-Azzam, G. Chen, D. L. Davis, T. K. Das, D. B. Hayer, D. Houde, S. K, Technical Decision Making With Higher Order Structure Data: Perspectives on Higher Order Structure Characterization From the Biopharmaceutical Industry, J. Pharm. Sci., 105 (2016) 3465-3470
2) M. T. Gutierrez Lugo, U.S. Food and Drug Administration, Regulatory Consideration for the Characterization of HOS in Biotechnology Products, 5th International Symposium on Higher Order Structure of Protein Therapeutics 2016
3) RePHAGEN Co., Ltd (https://rephagen.com/, May 20, 2020)
4) S. M. Kelly, N. C. Price, The Use of Circular Dichroism in the Investigation of Protein Structure and Function, Current Protein and Peptide Science, 1 (2000) 349-384.
Featured Products:
-
The basic, compact model for research, QA/QC, and teaching applications.
J-1100
-
UV/Visible/NIR measurements up to 2,500 nm for MCD and specialized applications.
J-1700
-
Automated high-throughput screening system for use with the J-1500/1700.
High-Throughput CD

Evaluation of HOS identity and VHH antibody binding to coronavirus using Circular Dichroism Spectroscopy
Introduction
The path of a biopharmaceutical from research and development to consumer availability is a long and thorough process, intended to ensure efficacious and quality control. Development of biosimilars requires evaluation of the molecule’s higher order structure (HOS) with the original biopharmaceutical. Additionally, the structure of biopharmaceuticals is sensitive to changes in the manufacturing process or storage environment and it is necessary to evaluate the higher order structure of these molecules sustained after any processing or storage alterations.
CD spectroscopy is widely used to assess HOS in biopharmaceuticals because the far-UV CD is sensitive to changes in the bond angles of a protein’s backbone chain and secondary structure and the near-UV monitors the tertiary structure, composed of aromatic amino acids residues and disulfide bonds. Here, we evaluate the HOS of three types of new anti-coronavirus (SARS-CoV-2) VHH antibodies using the [Spectral QC test] program that quantitatively determines the significance in structure changes based on the difference in CD spectral shape.
Experimental
| Far-UV Measurement Conditions | |||
| Wavelength | 250 - 200 nm | Bandwidth | 1 nm |
| D.I.T. | 4 sec | Scanning Speed | 50 nm/min |
| Data Interval | 0.1 nm | Accumulations | 1 |
| Near-UV Measurement Conditions | |||
| Wavelength | 310 - 250 nm | Bandwidth | 1 nm |
| D.I.T. | 4 sec | Scanning Speed | 20 nm/min |
| Data Interval | 0.1 nm | Accumulations | 4 |
Determination of differences in CD spectra
Far-UV CD measurements were acquired for 3 kinds of anti-SARS-CoV-2 VHH antibodies in 20 mM PBS buffer using the following concentrations: No.1 (0.2 mg/mL), No.2 (0.2 mg/mL), No.3 (0.2 mg/mL). Near-UV CD measurements were obtained on the same samples using the following concentrations: No.1 (6.27 mg/mL), No.2 (7.22 mg/mL), No.3 (5.15 mg/mL). All VHH antibody samples were provided by RePHAGEN3.
Figure 1 shows the method analysis steps for determining the CD spectrum difference between the reference and the sample in the [Spectrum QC Test] program, as explained below.
(1) Calculation of correlation coefficient: The CD spectrum of the reference sample is measured multiple times, and the correlation coefficient between the average spectrum R (λ) and the CD spectrum U (λ) of the sample is calculated.
(2) Weighting: The [Spectral QC Test] program allows the user to choose whether to weight the spectrum. The CD spectrum has a low S/N due to weak light energy detected in the shorter wavelength region as well as the wavelength region where sample absorption is strong. Therefore, it is possible to reduce the weighting of the spectrum in the wavelength range where the effects from noise are large and increase the weighting in the wavelength range where noise is small (Patent No. 6244492). As a result of this data processing, the influence of noise can be reduced in the wavelength range where the S/N is smaller, and the spectral difference between samples can be determined with high sensitivity.
(3) Quantify the difference (i.e. distance (I)) between the reference and sample CD spectra.
(4) Judgment: The Z-test determines if there is a significant difference between the reference and sample spectra. If the Z-score is 2 or less, the reference and the sample are judged to be the same, and if the Z-score is larger than 2, the reference and the sample are judged to be different.
Results
Visual comparison of CD spectra
Figure 2 shows the CD spectra of VHH antibodies in the far-UV region and near-UV region. In the far-UV region, a negative signal at 217 nm characteristic of β-sheet structure was observed only for sample No. 2 and no significant difference was observed in the CD spectra for samples No. 1 and No. 3. In the near-UV CD spectra, signals derived from phenylalanine (Phe) at 255 to 270 nm, tyrosine (Tyr) at 275 to 282 nm, and tryptophan (Trp) at 290 to 305 nm were observed in all samples. While the CD spectra of samples No. 2 and No. 3 are visually similar, the spectra of sample No. 1 is clearly different.
Judgment of slight CD spectrum difference by statistical method
The differences in the far-UV CD spectra of samples No. 1 and No. 3 and the near-UV CD spectra of samples No. 2 and No. 3 cannot be clearly discriminated. However, using the [Spectrum QC Test] program, the distance between the spectra was obtained by the analysis method shown in Figure 1, and the differences judged by the Z-test. The number of spectral data used for the analysis is as follows and the individual spectra are shown in Figure 3:
Far-UV region: Reference No. 1 (9 spectra), sample No. 3 (5 spectra)
Near-UV region: Reference No. 2 (9 spectra), sample No. 3 (5 spectra)
The distance between the reference and sample CD spectra is shown in Figure 4 and the corresponding values are shown in Table 1. From Figure 4 it can be seen that weighting both the far-UV and the near-UV spectra increases the distance between reference and sample and the difference between them can be clearly confirmed.
Table 1. Distances between the reference and sample far-UV (left) and near-UV (right) CD spectra.
| Far-UV | Reference (No. 1) | Sample (No. 3) | ||
| No. of Measurement | Weighted | No Weighting | Weighted | No Weighting |
| 1 | 0.9984 | 0.9987 | 0.9916 | 0.9935 |
| 2 | 0.9983 | 0.9985 | 0.9902 | 0.9921 |
| 3 | 0.9978 | 0.9983 | 0.9929 | 0.9945 |
| 4 | 0.9972 | 0.9968 | 0.9914 | 0.9928 |
| 5 | 0.9989 | 0.9988 | 0.9920 | 0.9937 |
| 6 | 0.9984 | 0.9987 | ||
| 7 | 0.9974 | 0.9973 | ||
| 8 | 0.9972 | 0.9974 | ||
| 9 | 0.9981 | 0.9982 | ||
| Near-UV | Reference (No. 1) | Sample (No. 3) | ||
| No. of Measurement | Weighted | No Weighting | Weighted | No Weighting |
| 1 | 0.99980 | 0.99973 | 0.9955 | 0.9956 |
| 2 | 0.99988 | 0.99984 | 0.9955 | 0.9954 |
| 3 | 0.99986 | 0.99982 | 0.9955 | 0.9954 |
| 4 | 0.99986 | 0.99983 | 0.9954 | 0.9955 |
| 5 | 0.99987 | 0.99983 | 0.9953 | 0.9952 |
| 6 | 0.99984 | 0.99978 | ||
| 7 | 0.99986 | 0.99981 | ||
| 8 | 0.99984 | 0.99979 | ||
| 9 | 0.99982 | 0.99976 | ||
In addition, the Z-scores are shown in Table 2. The Z-scores were all larger than 2 with and without weighting, indicating that there was a significant difference between the CD spectrum of the reference and sample both in the far- and near-UV.
Table 2. Calculated Z-scores from far-UV and near-UV CD spectra using [Spectrum QC Test] program.
[table “455” not found /]| No. of Measurement | Far-UV | Far-UV | ||
| Weighted | No Weighting | Weighted | No Weighting | |
| 1 | 11.5 | 6.8 | 184 | 123 |
| 2 | 13.9 | 9.0 | 183 | 126 |
| 3 | 9.0 | 5.4 | 184 | 126 |
| 4 | 11.7 | 7.9 | 187 | 124 |
| 5 | 10.6 | 6.6 | 194 | 134 |
Keywords
200-CD-0036B, New corona virus, SARS-CoV-2, COVID-19, Biopharmaceuticals, Antibody drug, BioSimilar, VHH antibody, HOS, Secondary Structure, Tertiary Structure, Circular Dichroism
References
1) W. F. W. 4th, J. P. Gabrielson, W. Al-Azzam, G. Chen, D. L. Davis, T. K. Das, D. B. Hayer, D. Houde, S. K, Technical Decision Making With Higher Order Structure Data: Perspectives on Higher Order Structure Characterization From the Biopharmaceutical Industry, J. Pharm. Sci., 105 (2016) 3465-3470
2) M. T. Gutierrez Lugo, U.S. Food and Drug Administration, Regulatory Consideration for the Characterization of HOS in Biotechnology Products, 5th International Symposium on Higher Order Structure of Protein Therapeutics 2016
3) RePHAGEN Co., Ltd (https://rephagen.com/, May 20, 2020)
4) S. M. Kelly, N. C. Price, The Use of Circular Dichroism in the Investigation of Protein Structure and Function, Current Protein and Peptide Science, 1 (2000) 349-384.