Fluorescence and CD Spectra using the Temperature/Wavelength Measurement
August 24, 2022
 Download This Application
Introduction
Fluorescence and CD spectroscopy are complementary techniques in the structural analysis of proteins. Fluorescence spectroscopy provides information about the protein’s aromatic residues, while CD spectroscopy can elucidate conformational changes occurring in the protein backbone. Additionally, the thermodynamic properties of a protein over the course of a varying temperature scan provide important information regarding the thermal stability of a protein.
The Temperature/Wavelength Scan program that accompanies the JASCO J-Series CD spectrometers can be used to obtain temperature-dependent CD spectra. The temperature-dependent data can be used to calculate the denaturation temperature (Tm), enthalpy changes (ΔH), and entropy changes (ΔS) for biological samples. This application program additionally provides temperature interval measurements of CD and fluorescence spectra.
The data obtained from the program can be processed using both the Spectrum Analysis and Interval Analysis programs, which can illustrate the data as a 3-D graphical representation. Secondary structure analysis and the calculation of the protein’s thermodynamic parameters can be made using the optional Thermal Denaturation Analysis and Protein Secondary Structure Estimation (SSE) programs.
This application note demonstrates the Temperature/ Wavelength Scan program for both circular dichroism and fluorescence using a lysozyme protein sample.
Experimental
| Measurement Conditions | |
|---|---|
| Data Acquisition Interval | 0.1 nm |
| Path Length | 10 mm |
| Spectral Bandwidth | 1 nm |
| Scan Speed | 100 nm/min |
| Accumulation | 2 times |
| Response Time | 1 sec |
| CD Wavelength | 222 nm |
| Excitation Wavelength | 280 nm |
| Excitation Bandwidth | 4 nm |
| Emission Bandwidth | 10 nm |
Keywords
Fluorescence, circular dichroism, secondary structure analysis, proteins, thermodynamics, thermal denaturation, enthalpy, entropy, melting temperature, lysozyme, J-1500, biochemistry
Results
Figure 1 shows the CD and fluorescence spectra of for the denaturation of lysozyme. Figure 1A illustrates the thermal denaturation curve for the CD measurement, monitored at 222 nm which is a marker band for α-helical secondary structure. Figure 1B is the 3-D graphical representation of the CD denaturation curve. Instead of monitoring the secondary structure at one wavelength, the CD far –UV (190-260 nm) spectrum was scanned at temperatures ranging from 25 to 95°C. Figure 1C is the 3-D graphical representation of the fluorescence denaturation curve. The same temperature range was used and the fluorescence intensity between 320 and 400 nm was obtained. Figure 1D is the fluorescence thermal denaturation curve of lysozyme. Here, the fluorescence intensity ratio at 357 and 338 nm was measured.
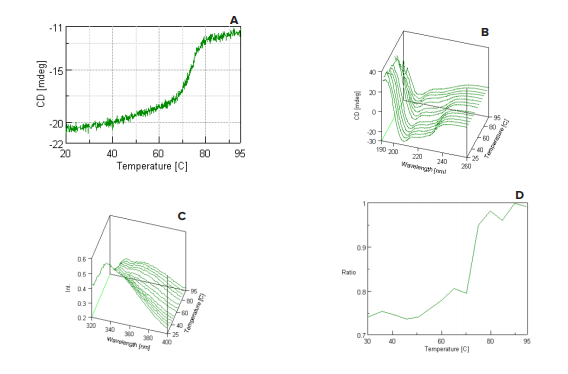
(A) CD thermal denaturation curve, (B) CD spectra as a function of wavelength and temperature, (C) fluorescence spectra as a function of wavelength and temperature, and (D) fluorescence intensity ratio (357/338 nm) as a function of temperature.
This application note demonstrates that the J-1500 CD spectrometer can be used to not only measure CD spectra, but also fluorescence spectra during the same measurement process. The Spectrum Analysis and Interval Analysis programs all for the user to either scan a particular region of either the CD or fluorescence spectrum, or to monitor a particular wavelength. The Thermal Denaturation Analysis and Protein SSE programs can also obtain melting temperatures and secondary structure percentages for the protein sample, respectively.
Featured Products:
-
Highest performance with a wide range of accessories for maximum flexibility to meet complex research demands.
J-1500
-
The basic, compact model for research, QA/QC, and teaching applications.
J-1100
-
Spectra Manager™ Spectroscopy Software

Fluorescence and CD Spectra using the Temperature/Wavelength Measurement
Introduction
Fluorescence and CD spectroscopy are complementary techniques in the structural analysis of proteins. Fluorescence spectroscopy provides information about the protein’s aromatic residues, while CD spectroscopy can elucidate conformational changes occurring in the protein backbone. Additionally, the thermodynamic properties of a protein over the course of a varying temperature scan provide important information regarding the thermal stability of a protein.
The Temperature/Wavelength Scan program that accompanies the JASCO J-Series CD spectrometers can be used to obtain temperature-dependent CD spectra. The temperature-dependent data can be used to calculate the denaturation temperature (Tm), enthalpy changes (ΔH), and entropy changes (ΔS) for biological samples. This application program additionally provides temperature interval measurements of CD and fluorescence spectra.
The data obtained from the program can be processed using both the Spectrum Analysis and Interval Analysis programs, which can illustrate the data as a 3-D graphical representation. Secondary structure analysis and the calculation of the protein’s thermodynamic parameters can be made using the optional Thermal Denaturation Analysis and Protein Secondary Structure Estimation (SSE) programs.
This application note demonstrates the Temperature/ Wavelength Scan program for both circular dichroism and fluorescence using a lysozyme protein sample.
Experimental
| Measurement Conditions | |
|---|---|
| Data Acquisition Interval | 0.1 nm |
| Path Length | 10 mm |
| Spectral Bandwidth | 1 nm |
| Scan Speed | 100 nm/min |
| Accumulation | 2 times |
| Response Time | 1 sec |
| CD Wavelength | 222 nm |
| Excitation Wavelength | 280 nm |
| Excitation Bandwidth | 4 nm |
| Emission Bandwidth | 10 nm |
Results
Figure 1 shows the CD and fluorescence spectra of for the denaturation of lysozyme. Figure 1A illustrates the thermal denaturation curve for the CD measurement, monitored at 222 nm which is a marker band for α-helical secondary structure. Figure 1B is the 3-D graphical representation of the CD denaturation curve. Instead of monitoring the secondary structure at one wavelength, the CD far –UV (190-260 nm) spectrum was scanned at temperatures ranging from 25 to 95°C. Figure 1C is the 3-D graphical representation of the fluorescence denaturation curve. The same temperature range was used and the fluorescence intensity between 320 and 400 nm was obtained. Figure 1D is the fluorescence thermal denaturation curve of lysozyme. Here, the fluorescence intensity ratio at 357 and 338 nm was measured.
(A) CD thermal denaturation curve, (B) CD spectra as a function of wavelength and temperature, (C) fluorescence spectra as a function of wavelength and temperature, and (D) fluorescence intensity ratio (357/338 nm) as a function of temperature.
This application note demonstrates that the J-1500 CD spectrometer can be used to not only measure CD spectra, but also fluorescence spectra during the same measurement process. The Spectrum Analysis and Interval Analysis programs all for the user to either scan a particular region of either the CD or fluorescence spectrum, or to monitor a particular wavelength. The Thermal Denaturation Analysis and Protein SSE programs can also obtain melting temperatures and secondary structure percentages for the protein sample, respectively.
Keywords
Fluorescence, circular dichroism, secondary structure analysis, proteins, thermodynamics, thermal denaturation, enthalpy, entropy, melting temperature, lysozyme, J-1500, biochemistry