High-Sensitivity Fluorescence-Detected Circular Dichroism (FDCD) Measurement
January 5, 2024
 Download This Application
Introduction
Fluorescence-detected circular dichroism (FDCD) can be used to measure the difference in fluorescence intensities when an optically active sample has been excited with circularly polarized light. FDCD offers superior selectivity in that it allows the user to measure the circular dichroism of a specific fluorescent chromophore in a group of nonfluorescent, chiral molecules. During an FDCD measurement, the molar circular dichroism can be calculated from the FDCD results and the following equation:
Δε = εl- εr= (3.032 ∙ 10-5) ∙ S ∙ (1 – 10-A) / c ∙ l ∙ 10-A) [1]
where εl – εr is the difference between left and right circular dichroism, S is the measured FDCD value, A is the absorbance of the sample, c is the concentration and l is the cell’s path length.
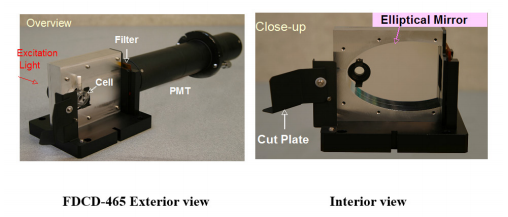
The JASCO FDCD-465 is a highly sensitive FDCD measurement accessory which combines both a cylindrical cell and an elliptical cylinder mirror (Figure 1). This design allows for the collection of all radiated fluorescence light which is emitted in a circumferential direction from the cell. The result not only improves the light collection efficiency, but also the ability to eliminate the artifacts effects caused by fluorescence anisotropy. [2] [3]
Solvents with high viscosities can also contribute to anisotropy effects, inducing artifacts. To further minimize these effects, the FDCD-465 includes a balancing mask. If the fluorescence light in the F-y direction does not reach the detector due to a blockage from the cell itself, the fluorescence intensity of F+x + F-x can become slightly greater than F+y + F-y, which could cause an artifact. By using the balancing mask, the intensities of these fluorescence signals can be balanced to eliminate the artifacts, even when using solvents with high viscosity.
In this application note, the J-1500 Circular Dichroism spectrometer and FCDC-465 accessory were used to measure ammonium d-10-camphorsulfonic acid in water.
Experimental
| Spectral bandwidth | 4 nm | Spectral bandwidth | 2 nm |
| Accumulations | 16 times | Accumulations | 8 times |
Keywords
260-CD-0006, J-1500, J-820, Circular Dichroism, CD, fluorescence-detected circular dichroism, FDCD-465, fluorescence, biochemistry
Results
Since the FDCD is an excitation spectrum, the excitation and emission wavelengths need to be obtained using a fluorescence spectrometer prior to FDCD measurements. An excitation wavelength of 285 nm was obtained from the fluorescence experiments along with a fluorescence emission maxima at 427 nm. These wavelengths were then used to measure the FDCD of 0.0024 M ammonium d-10-camphorsulfonic acid (d-10-ACS), which is shown in Figure 2.
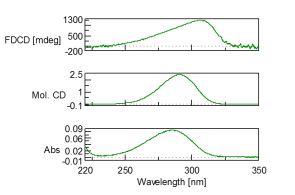
Based on the obtained FDCDC, CD, and absorption spectra, the CD spectrum was converted from FDCD using equation 1. A comparison of a measured CD spectrum and CD spectrum calculated from FDCD measurements is shown in Figure 2 and depicts that the spectra are in good agreement with each other.
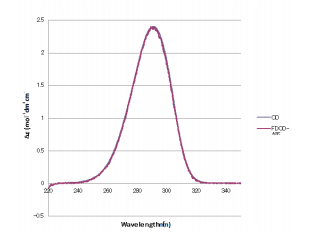
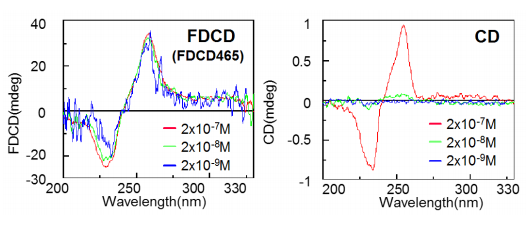
Figure 4 shows the FDCD and CD spectra of (1S,2S)-trans-cyclohexanediol bis (6-methoxy-2-naphthoate) and acetonitrile solution at varying concentrations, respectively. For the FDCD data (left), the difference in the fluorescence intensity excited by circularly polarized light is normalized against the intensity of the total fluorescence. Therefore, the FDCD signal (mdeg) shown in Figure 4 displays a constant value regardless of sample concentration.
In the CD measurements, a CD signal could only be observed with a concentration of 2 · 10-7 M. The concentrations at 2 · 10-8 M and 2 · 10-9 M did not show usable CD signals. However, using the FDCD-465 accessory for spectral measurements, a signal was clearly observed with a concentration two orders of magnitude lower than 2 · 10-7M.
Conclusion
This application note demonstrates that if a sample is amendable to FDCD measurement, much higher selectivity and sensitivity can be achieved compared to standard CD measurements.
References
- Turner, D.H., Tinoco Jr, I., and M. Maestre, (1974) JACS, 96, 4340-4342.
- Nehira, T., tanaka, K., Takakuwa, T., Ohshima, C., Masago, H., Pescitelli, G., Wada, A., and N. Berova, (2005) Applied Spectroscopy, 59, 121-125.
- Tanaka, K., Pescitelli, G., Nakanishi, K., and N. Berova, (2005) Monatshefte für Chemie/Chemical Monthly, 136, 367-395.
- T. Nehira, (2005) Monatshefte für Chemie/Chemical Monthly, 136, 447-487.
- Dong, J.G., Wada, A., Takakuwa, T., Nakanishi, K., and N. Berova, (1997) JACS, 119, 12024-12025.
- Muto, K., Mochizuki, H., Yoshida, R., Ishii, T., and T. Handa, (1986) JACS, 108, 6416-6417.
- 7. Nehira, T., Parish, C. A., Jochusch, S., Turro, N. J., Nakanishi, K., and N. Berova, (1999) JACS, 121, 8681-8691.
Featured Products:

High-Sensitivity Fluorescence-Detected Circular Dichroism (FDCD) Measurement
Introduction
Fluorescence-detected circular dichroism (FDCD) can be used to measure the difference in fluorescence intensities when an optically active sample has been excited with circularly polarized light. FDCD offers superior selectivity in that it allows the user to measure the circular dichroism of a specific fluorescent chromophore in a group of nonfluorescent, chiral molecules. During an FDCD measurement, the molar circular dichroism can be calculated from the FDCD results and the following equation:
Δε = εl- εr= (3.032 ∙ 10-5) ∙ S ∙ (1 – 10-A) / c ∙ l ∙ 10-A) [1]
where εl – εr is the difference between left and right circular dichroism, S is the measured FDCD value, A is the absorbance of the sample, c is the concentration and l is the cell’s path length.
The JASCO FDCD-465 is a highly sensitive FDCD measurement accessory which combines both a cylindrical cell and an elliptical cylinder mirror (Figure 1). This design allows for the collection of all radiated fluorescence light which is emitted in a circumferential direction from the cell. The result not only improves the light collection efficiency, but also the ability to eliminate the artifacts effects caused by fluorescence anisotropy. [2] [3]
Solvents with high viscosities can also contribute to anisotropy effects, inducing artifacts. To further minimize these effects, the FDCD-465 includes a balancing mask. If the fluorescence light in the F-y direction does not reach the detector due to a blockage from the cell itself, the fluorescence intensity of F+x + F-x can become slightly greater than F+y + F-y, which could cause an artifact. By using the balancing mask, the intensities of these fluorescence signals can be balanced to eliminate the artifacts, even when using solvents with high viscosity.
In this application note, the J-1500 Circular Dichroism spectrometer and FCDC-465 accessory were used to measure ammonium d-10-camphorsulfonic acid in water.
Experimental
| Spectral bandwidth | 4 nm | Spectral bandwidth | 2 nm |
| Accumulations | 16 times | Accumulations | 8 times |
Results
Since the FDCD is an excitation spectrum, the excitation and emission wavelengths need to be obtained using a fluorescence spectrometer prior to FDCD measurements. An excitation wavelength of 285 nm was obtained from the fluorescence experiments along with a fluorescence emission maxima at 427 nm. These wavelengths were then used to measure the FDCD of 0.0024 M ammonium d-10-camphorsulfonic acid (d-10-ACS), which is shown in Figure 2.
Based on the obtained FDCDC, CD, and absorption spectra, the CD spectrum was converted from FDCD using equation 1. A comparison of a measured CD spectrum and CD spectrum calculated from FDCD measurements is shown in Figure 2 and depicts that the spectra are in good agreement with each other.
Figure 4 shows the FDCD and CD spectra of (1S,2S)-trans-cyclohexanediol bis (6-methoxy-2-naphthoate) and acetonitrile solution at varying concentrations, respectively. For the FDCD data (left), the difference in the fluorescence intensity excited by circularly polarized light is normalized against the intensity of the total fluorescence. Therefore, the FDCD signal (mdeg) shown in Figure 4 displays a constant value regardless of sample concentration.
In the CD measurements, a CD signal could only be observed with a concentration of 2 · 10-7 M. The concentrations at 2 · 10-8 M and 2 · 10-9 M did not show usable CD signals. However, using the FDCD-465 accessory for spectral measurements, a signal was clearly observed with a concentration two orders of magnitude lower than 2 · 10-7M.
Conclusion
This application note demonstrates that if a sample is amendable to FDCD measurement, much higher selectivity and sensitivity can be achieved compared to standard CD measurements.
Keywords
260-CD-0006, J-1500, J-820, Circular Dichroism, CD, fluorescence-detected circular dichroism, FDCD-465, fluorescence, biochemistry
References
- Turner, D.H., Tinoco Jr, I., and M. Maestre, (1974) JACS, 96, 4340-4342.
- Nehira, T., tanaka, K., Takakuwa, T., Ohshima, C., Masago, H., Pescitelli, G., Wada, A., and N. Berova, (2005) Applied Spectroscopy, 59, 121-125.
- Tanaka, K., Pescitelli, G., Nakanishi, K., and N. Berova, (2005) Monatshefte für Chemie/Chemical Monthly, 136, 367-395.
- T. Nehira, (2005) Monatshefte für Chemie/Chemical Monthly, 136, 447-487.
- Dong, J.G., Wada, A., Takakuwa, T., Nakanishi, K., and N. Berova, (1997) JACS, 119, 12024-12025.
- Muto, K., Mochizuki, H., Yoshida, R., Ishii, T., and T. Handa, (1986) JACS, 108, 6416-6417.
- 7. Nehira, T., Parish, C. A., Jochusch, S., Turro, N. J., Nakanishi, K., and N. Berova, (1999) JACS, 121, 8681-8691.